Fig. 11
Download original image
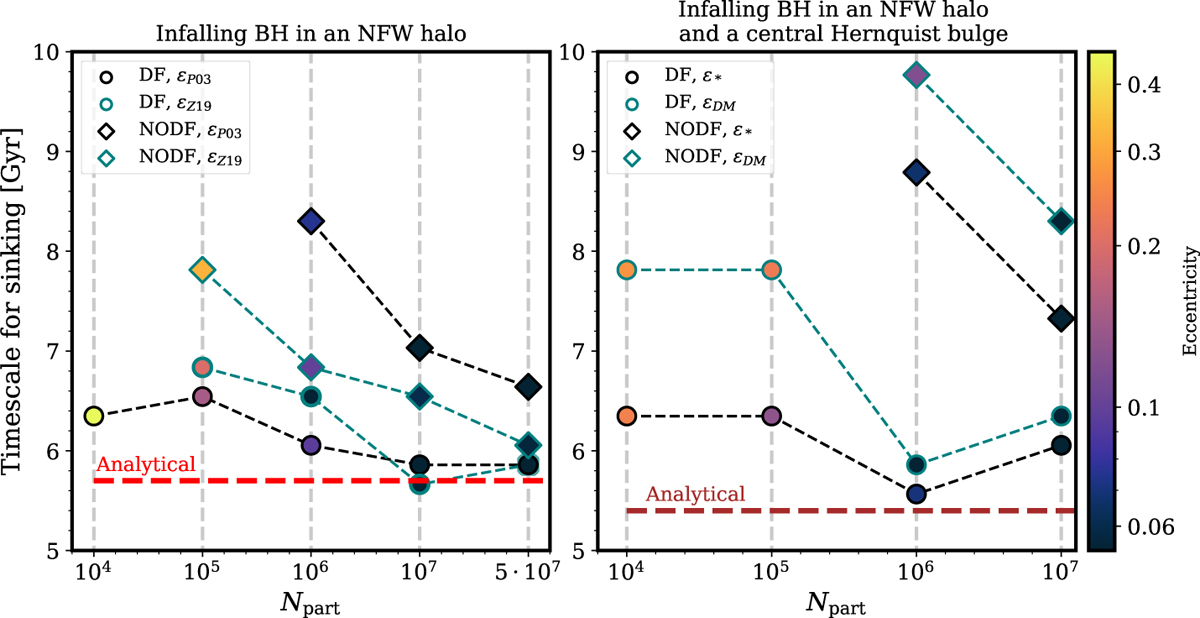
BH sinking timescale as a function of the total number of particles in the halo, for a pure DM NFW halo (left) and for a DM halo with a central Hernquist bulge (right). Diamonds indicate simulations without DF correction, circles indicate simulations with DF correction. The horizontal red dashed line shows the analytical sinking timescale from OTIS. In the left panel, teal-edged points, connected by teal dashed lines, adopt softening from Eq. (30), black-edged points connected by black dashed lines are for the softening from Eq. (29). In the right panel, teal edges and teal dashed lines correspond to ϵBH = ϵDM, while black edges with black dashed lines correspond to ϵBH = ϵ∗. The color of each point indicates the BH orbital eccentricity, as highlighted in the colorbar.
Current usage metrics show cumulative count of Article Views (full-text article views including HTML views, PDF and ePub downloads, according to the available data) and Abstracts Views on Vision4Press platform.
Data correspond to usage on the plateform after 2015. The current usage metrics is available 48-96 hours after online publication and is updated daily on week days.
Initial download of the metrics may take a while.