Fig. A.1
Download original image
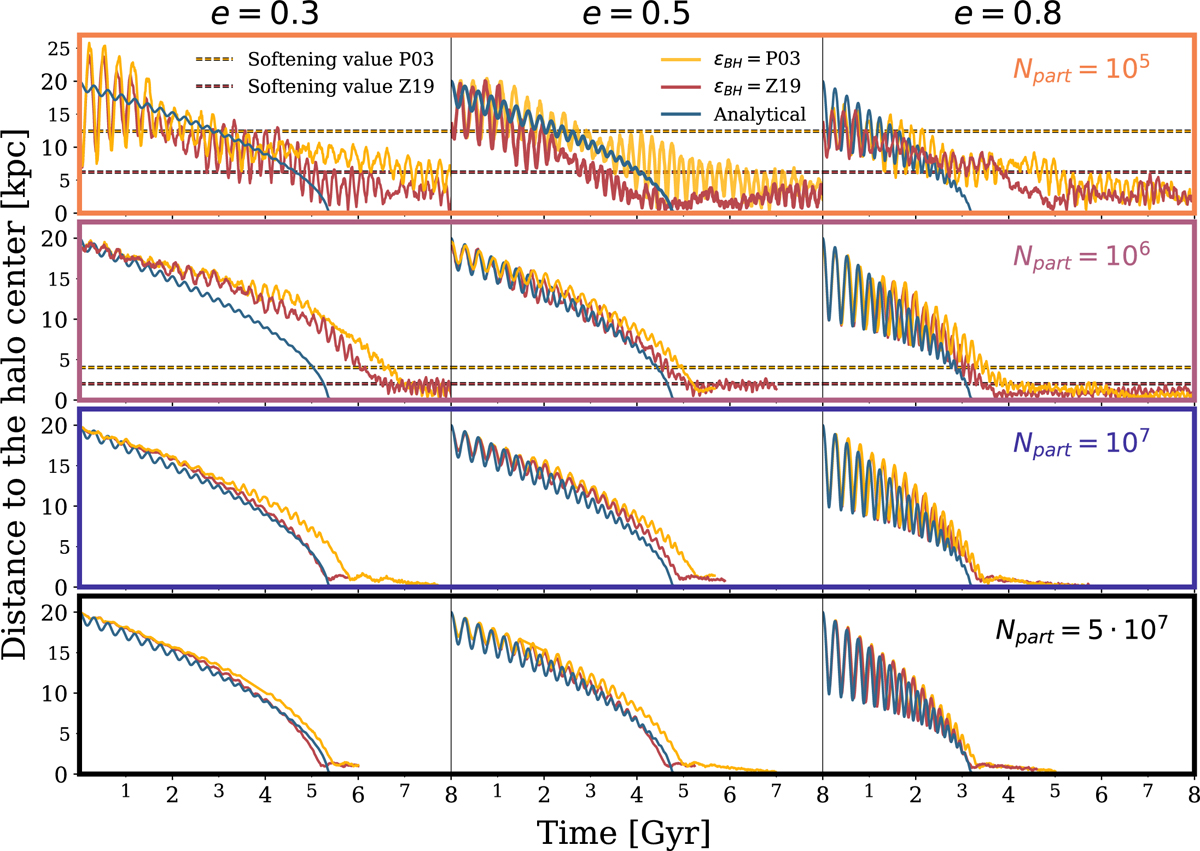
BH distance from the halo centre over time, starting from an initial position at 20 kpc, with orbital eccentricities e = 0.3, 0.5, 0.8 shown in the first, second, and third columns, respectively. Each row represents a different halo resolution: Npart = 105, 106, 107, 5 · 107 from top to bottom. Yellow lines show results for simulations with P03 softening lengths, and red lines indicate Z19 softenings. Analytical predictions for each orbital eccentricity are represented as a blue line. Dotted lines mark softening values for each resolution (yellow edge for P03, red edge for Z19). All simulations apply the DF correction from D24.
Current usage metrics show cumulative count of Article Views (full-text article views including HTML views, PDF and ePub downloads, according to the available data) and Abstracts Views on Vision4Press platform.
Data correspond to usage on the plateform after 2015. The current usage metrics is available 48-96 hours after online publication and is updated daily on week days.
Initial download of the metrics may take a while.