Fig. 4
Download original image
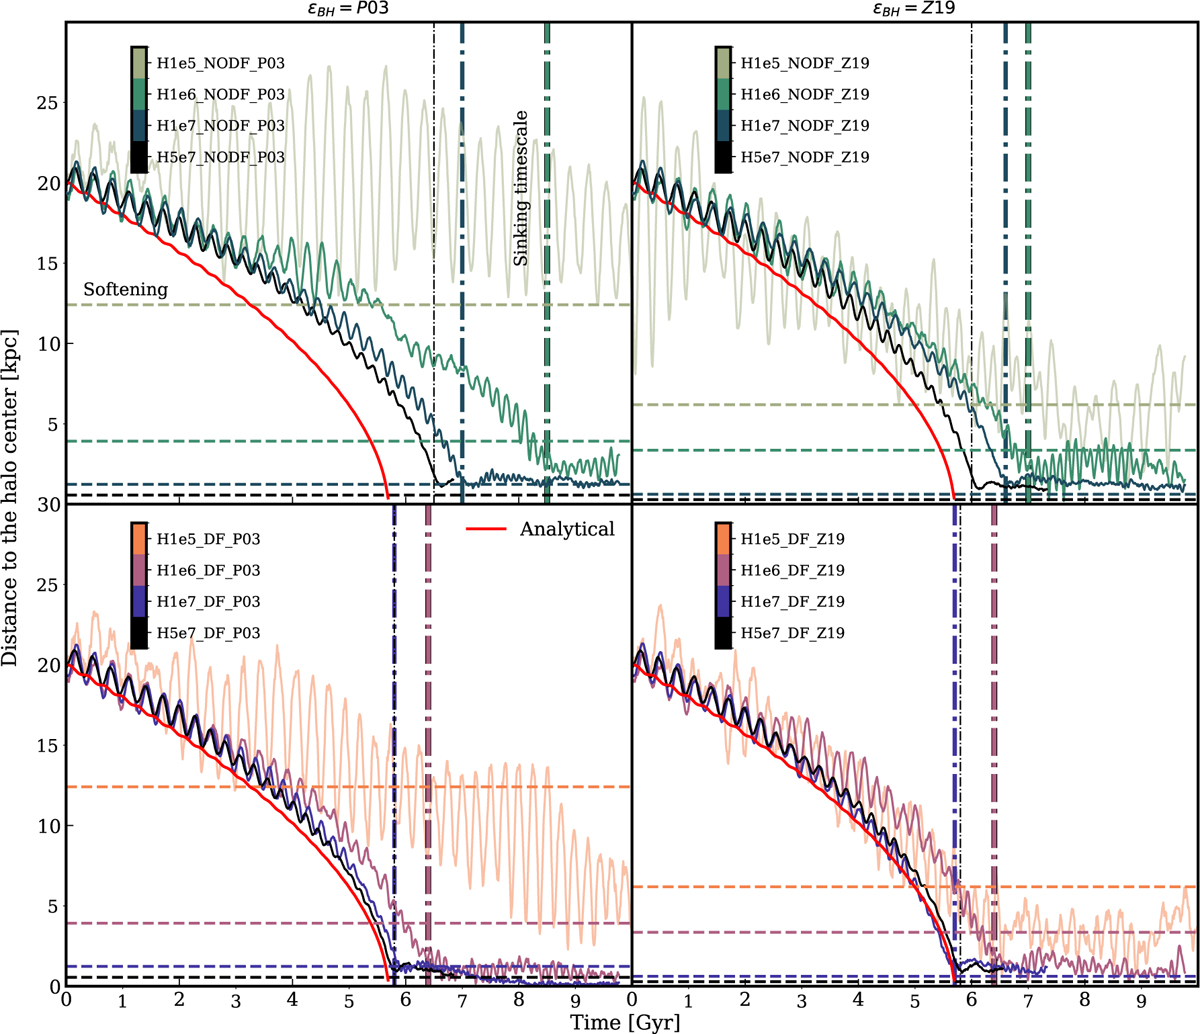
Sinking timescales for a BH initially seeded on a circular orbits within a DM-only NFW halo at 20 kpc from the halo centre. The left and right columns show simulations with softenings derived from Eqs. (29) and (30), respectively. Top plots refer to simulations without any DF correction, while the bottom plots include the DF correction according to D24. Lines are color-coded by resolution, with lighter to darker shades indicating increasing resolution (as shown in the colormap). Horizontal dotted lines represent the softening lengths, and vertical dash-dotted lines mark the sinking timescales for the three highest resolution runs. The red line shows the analytically predicted merging timescale using bmax = 20 kpc.
Current usage metrics show cumulative count of Article Views (full-text article views including HTML views, PDF and ePub downloads, according to the available data) and Abstracts Views on Vision4Press platform.
Data correspond to usage on the plateform after 2015. The current usage metrics is available 48-96 hours after online publication and is updated daily on week days.
Initial download of the metrics may take a while.