Fig. 5
Download original image
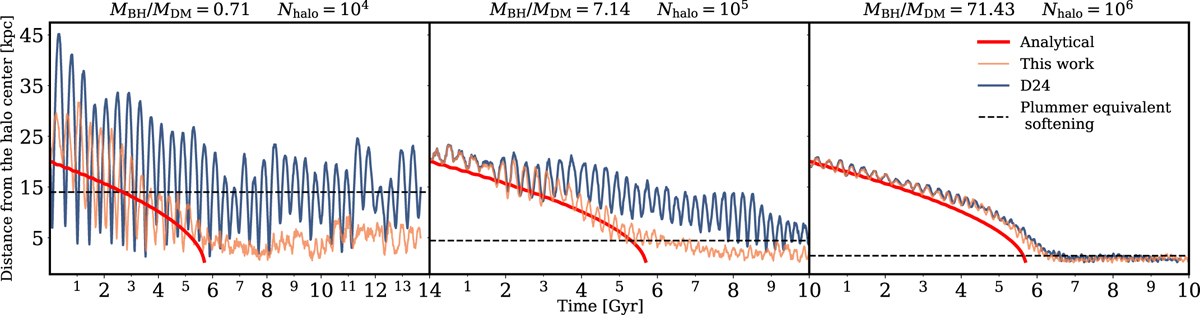
Trajectories of a BH placed on a circular orbit at 20 kpc from the centre of a DM halo for three different halo resolutions. From left to right, the halo is sampled with 104, 105 and 106 particles. The dashed black lines indicate the Plummer-equivalent softening length of each simulation. Orange lines represent the BH trajectory when the DF correction is applied according to Eq. (33), while the blue lines correspond to the original DF correction in Eq. (6) of D24, the red line shows the analytical prediction from OTIS (Sect. 2.4). The ratio of the BH mass to the surrounding DM particle mass is indicated at the top of each panel.
Current usage metrics show cumulative count of Article Views (full-text article views including HTML views, PDF and ePub downloads, according to the available data) and Abstracts Views on Vision4Press platform.
Data correspond to usage on the plateform after 2015. The current usage metrics is available 48-96 hours after online publication and is updated daily on week days.
Initial download of the metrics may take a while.