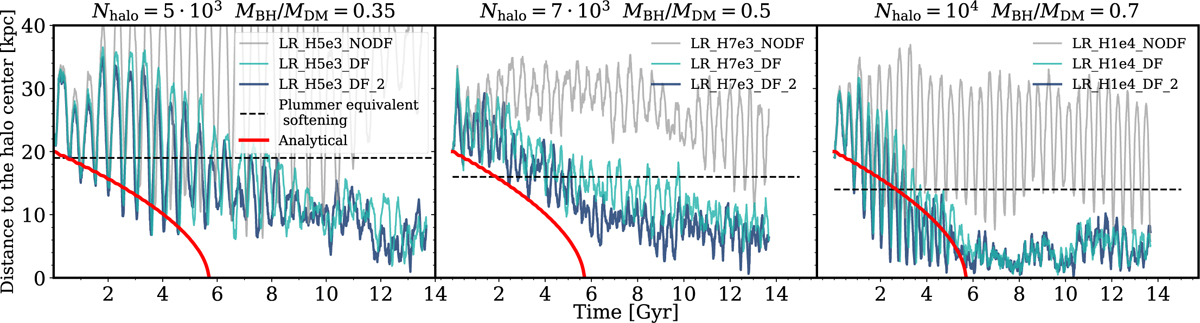
Fig. 6
Download original image
Sinking path of a BH of mass MBH infalling in a DM halo sampled with DM particles of mass MDM such that MBH/MDM < 1. Each column refers to a different halo sampling, with increasing halo resolution from left to right. The grey curve corresponds to the simulation without the DF correction, whereas the blue curve refer to the simulation where the DF correction applied to the BH and computed according to Eq. (33) with bmax,c = 2ϵBH and bmax,c = ϵBH (lighter curve). We report in red the analytical estimation from OTIS. The Plummer-equivalent softening in each simulation is marked with the horizontal dashed line. For the details of each simulation, refer to Table 1.
Current usage metrics show cumulative count of Article Views (full-text article views including HTML views, PDF and ePub downloads, according to the available data) and Abstracts Views on Vision4Press platform.
Data correspond to usage on the plateform after 2015. The current usage metrics is available 48-96 hours after online publication and is updated daily on week days.
Initial download of the metrics may take a while.