Fig. 7
Download original image
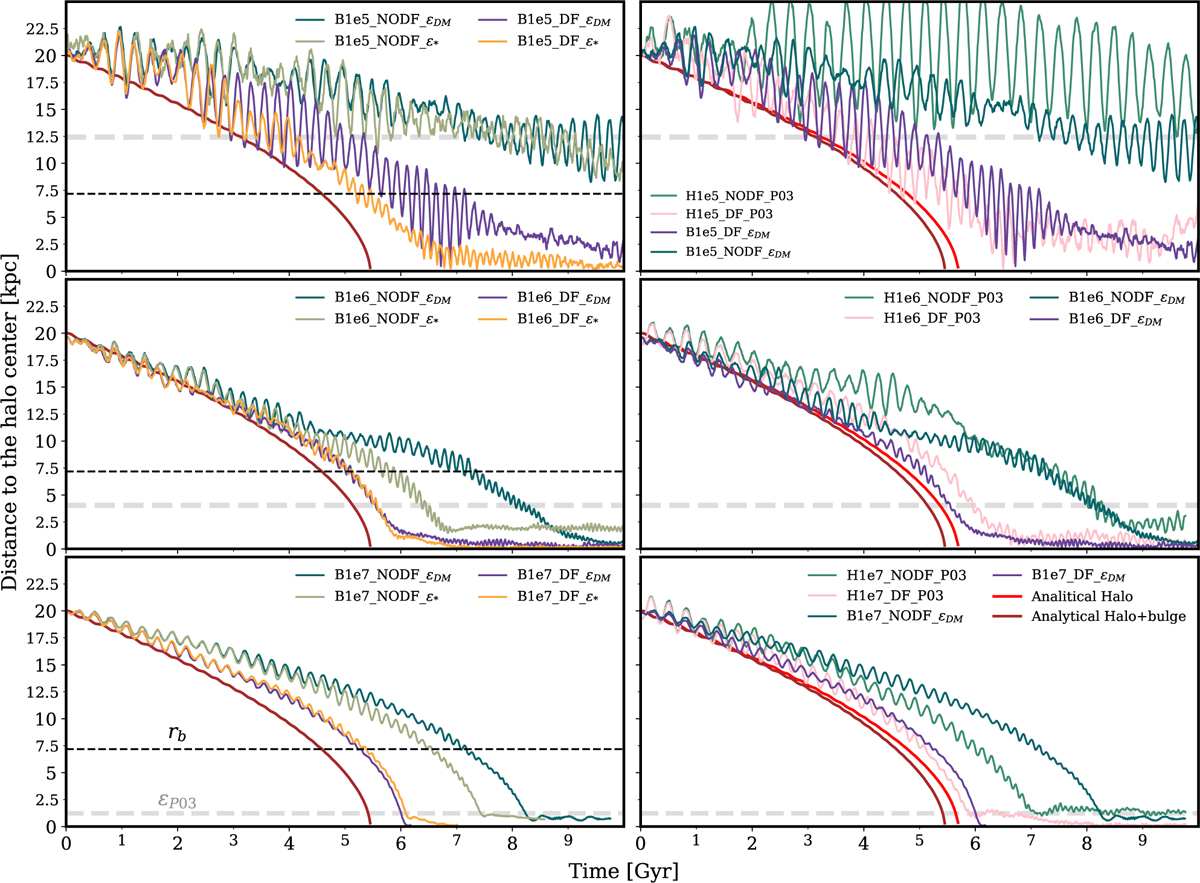
Comparison of the evolution of BH halo-centric distances during the BH sinking for different simulation setups. From the upper to the bottom row we show the results at increasing resolutions. Left column compares simulation using ϵBH = ϵDM or ϵBH = ϵ∗ for simulation with and without the DF correction. The right panels display the results for a BH embedded either in the NFW halo alone (as described in Sect. 3.2) or with the addition of a central stellar bulge. The red curves show the analytical predictions computed with OTIS, with the lighter curve corresponding to the DM-only case and the darker curve including the central bulge. Dashed horizontal lines indicate the Plummer-equivalent softenings used in the simulations, with Z19 softenings marked in black and P03 softenings in grey.
Current usage metrics show cumulative count of Article Views (full-text article views including HTML views, PDF and ePub downloads, according to the available data) and Abstracts Views on Vision4Press platform.
Data correspond to usage on the plateform after 2015. The current usage metrics is available 48-96 hours after online publication and is updated daily on week days.
Initial download of the metrics may take a while.