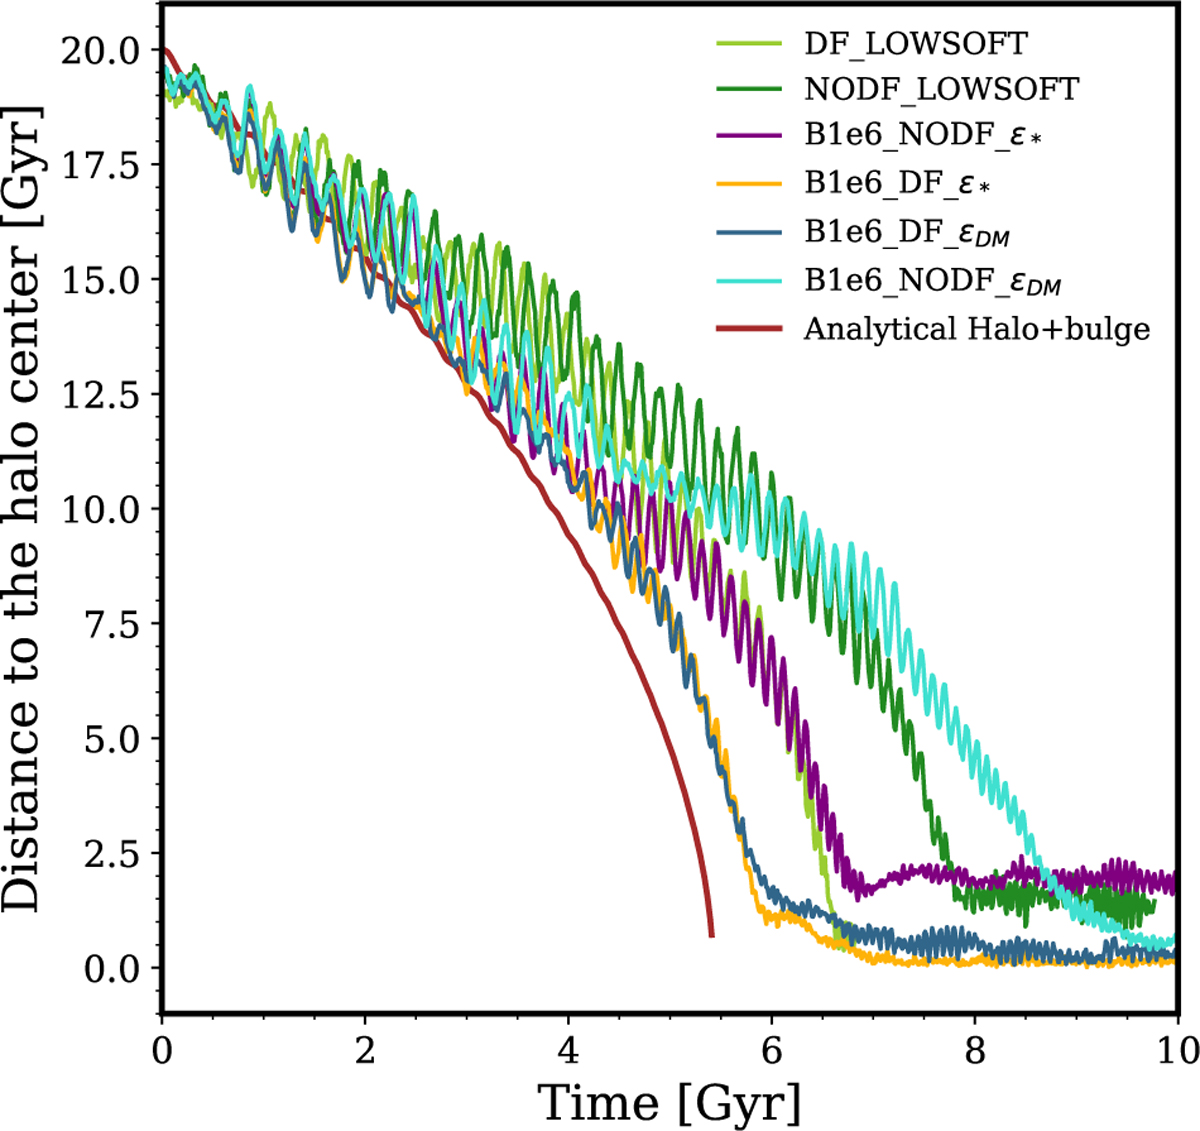
Fig. 8
Download original image
Evolution of the BH–halo centre distance for simulations with the same mass resolution as B1e6_DF_ϵ∗ but using reduced gravitational softening lengths: ϵDM = 0.72, ϵBH = ϵ∗ = 0.25. The green curves show the results from these simulations, with the darker line corresponding to the run without dynamical friction (NODF_LOWSOFT) and the lighter green line including the DF correction (DF_LOWSOFT). For reference, we plot in yellow and purple the outcome of B1e6_DF_ϵ∗ and B1e6_NODF_ϵ∗, while blue curves shows the results from B1e6_NODF_ϵDM (light) and B1e6_DF_ϵDM (dark). The red line represents the analytical predictions from OTIS.
Current usage metrics show cumulative count of Article Views (full-text article views including HTML views, PDF and ePub downloads, according to the available data) and Abstracts Views on Vision4Press platform.
Data correspond to usage on the plateform after 2015. The current usage metrics is available 48-96 hours after online publication and is updated daily on week days.
Initial download of the metrics may take a while.