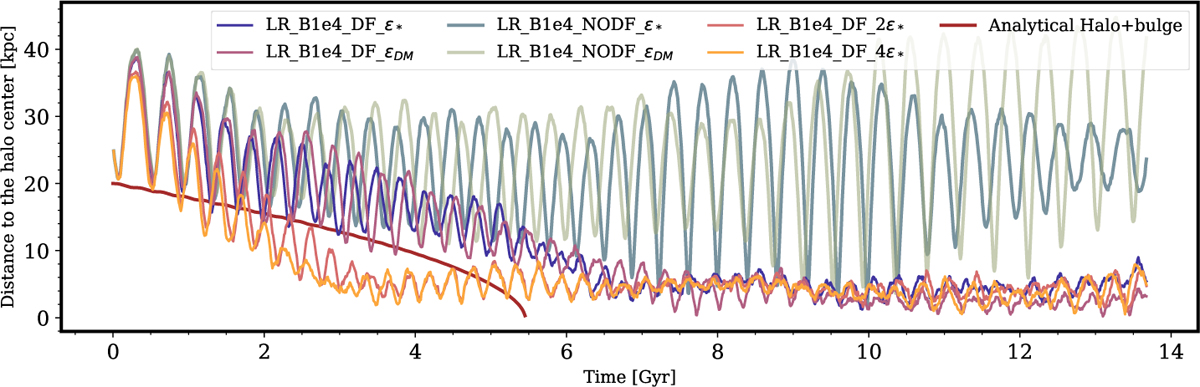
Fig. 9
Download original image
Evolution of the BH’s distance from the halo centre in low-resolution simulations including both a DM halo and a stellar bulge. The figure compares different setups: no DF correction (lighter and darker lines for different softening choices), DF correction with bmax,c = ϵBH and ϵBH = ϵDM or ϵBH = ϵ∗(lighter and darker purple lines), and DF correction with an extended impact parameter bmax,c = 2ϵBH, 4ϵBH (lighter and darker orange lines). The brown curve represents the analytical sinking timescale from OTIS.
Current usage metrics show cumulative count of Article Views (full-text article views including HTML views, PDF and ePub downloads, according to the available data) and Abstracts Views on Vision4Press platform.
Data correspond to usage on the plateform after 2015. The current usage metrics is available 48-96 hours after online publication and is updated daily on week days.
Initial download of the metrics may take a while.