Fig. 1.
Download original image
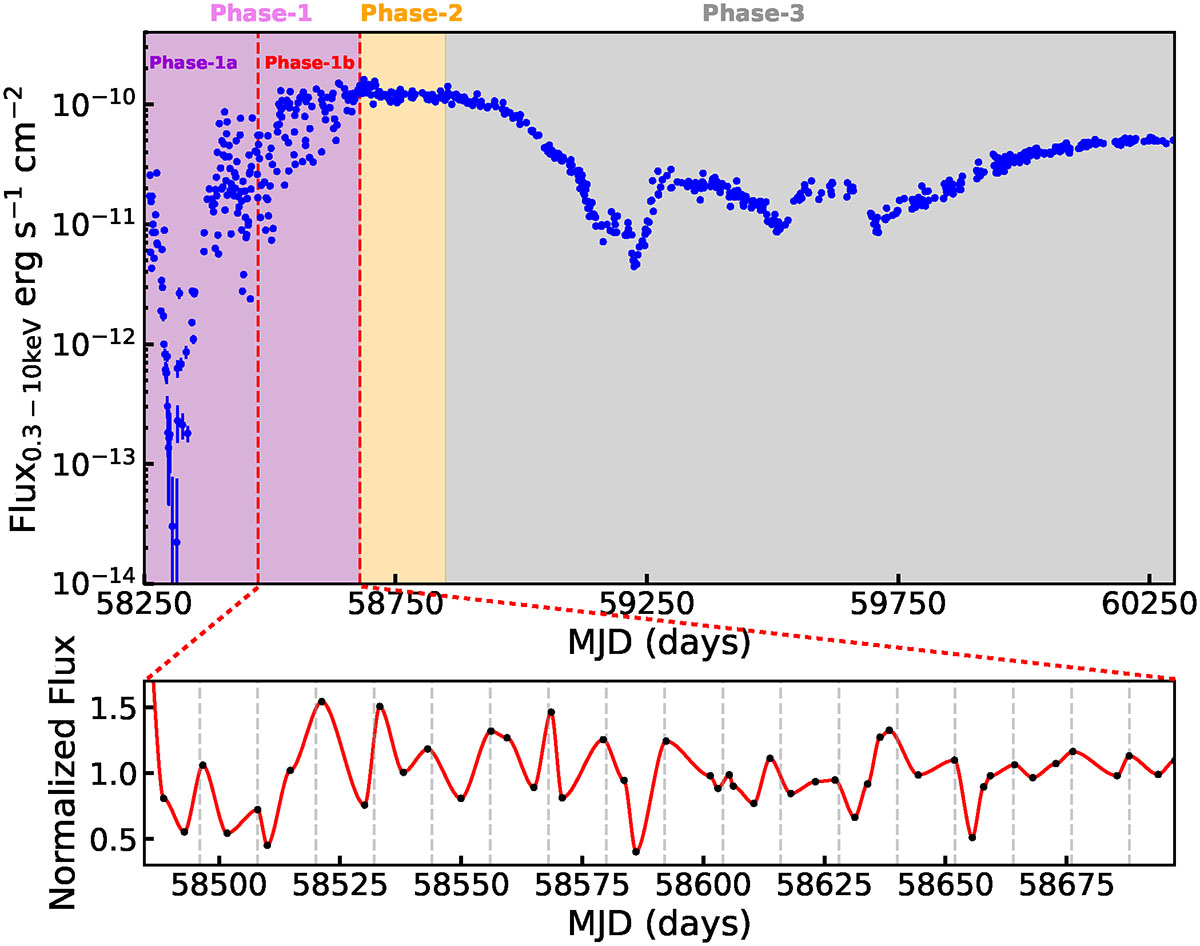
Top panel: 0.3–10 keV NICER X-ray light curve for 1ES 1927+654 since May 2018 (blue). Following the methodology of Masterson et al. (2022), we divided the long-term X-ray light curve of 1ES 1927+654 into distinct phases. Phase 1 is characterized by a super-Eddington state with rapid fluctuations in both X-ray luminosity and spectral parameters. Phase 2 maintains a stable super-Eddington luminosity near its peak. Phase 3 exhibits a gradual decline in X-ray luminosity and spectral parameters, returning to levels comparable to those observed prior to the outburst. Phase 1 is divided into two equal segments and phase 1b is between the two vertical dashed red lines in phase 1. Bottom panel: Observation data in phase 1b plotted as black points after binning all observations within three-day intervals for visual clarity. To enhance the visibility of the periodic signal, we applied the logarithmic function f(x) = A ⋅ log(Bx + C)+D and removed the long-term trend, connecting the data and model points with a smoothed curve. Note: this approach is intended solely for visual illustration of periodicity. Dashed gray vertical lines denote a period of 11.6 days.
Current usage metrics show cumulative count of Article Views (full-text article views including HTML views, PDF and ePub downloads, according to the available data) and Abstracts Views on Vision4Press platform.
Data correspond to usage on the plateform after 2015. The current usage metrics is available 48-96 hours after online publication and is updated daily on week days.
Initial download of the metrics may take a while.