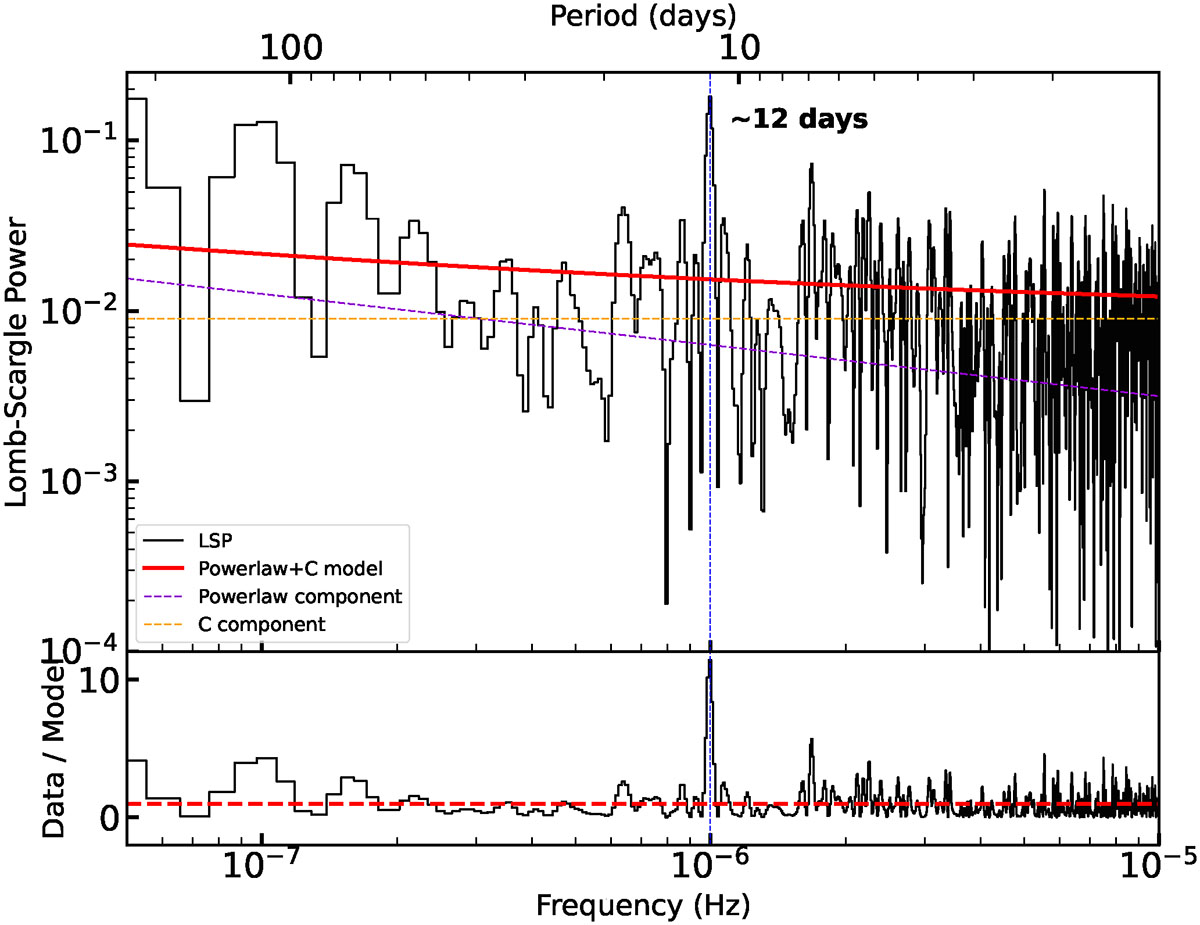
Fig. 2.
Download original image
LSP of the 0.3–2 keV light curve during phase 1b. The red solid curve represents the best-fit power-law + constant model. The blue vertical line marks the frequency of the QPO at approximately 1 × 10⁻⁶ Hz (∼12 days). The lower panel shows the data-to-model ratio as a function of frequency, where the QPO feature is clearly visible after subtracting the continuum modeled by the power-law + constant model.
Current usage metrics show cumulative count of Article Views (full-text article views including HTML views, PDF and ePub downloads, according to the available data) and Abstracts Views on Vision4Press platform.
Data correspond to usage on the plateform after 2015. The current usage metrics is available 48-96 hours after online publication and is updated daily on week days.
Initial download of the metrics may take a while.