Fig. 3.
Download original image
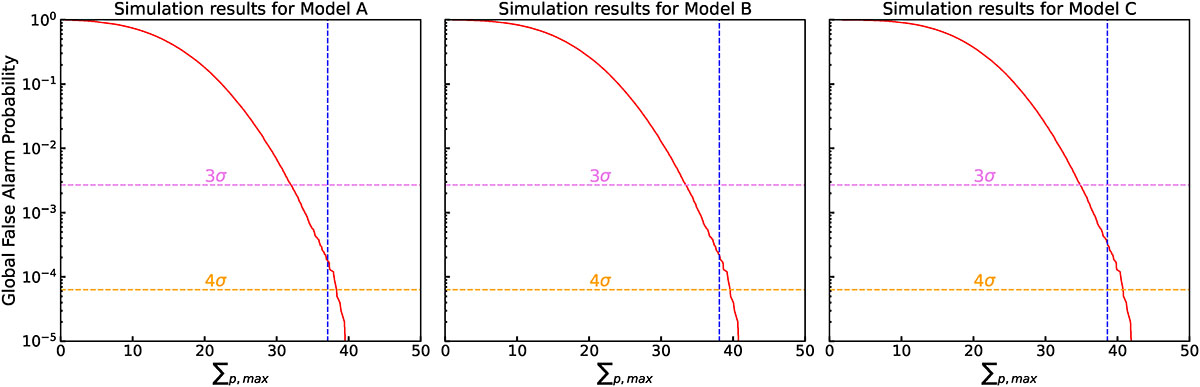
Global false alarm probability of finding a multi-component peak in the simulated LSPs. Each of the three panels presents simulation results computed using the continuum models of model A, model B, and model C, respectively. The dashed, vertical blue line in each panel represent the observed ∑p, max, obs at 12 days. The violet and orange dashed horizontal lines mark the locations of 3σ and 4σ, respectively.
Current usage metrics show cumulative count of Article Views (full-text article views including HTML views, PDF and ePub downloads, according to the available data) and Abstracts Views on Vision4Press platform.
Data correspond to usage on the plateform after 2015. The current usage metrics is available 48-96 hours after online publication and is updated daily on week days.
Initial download of the metrics may take a while.