Open Access
Fig. A.1.
Download original image
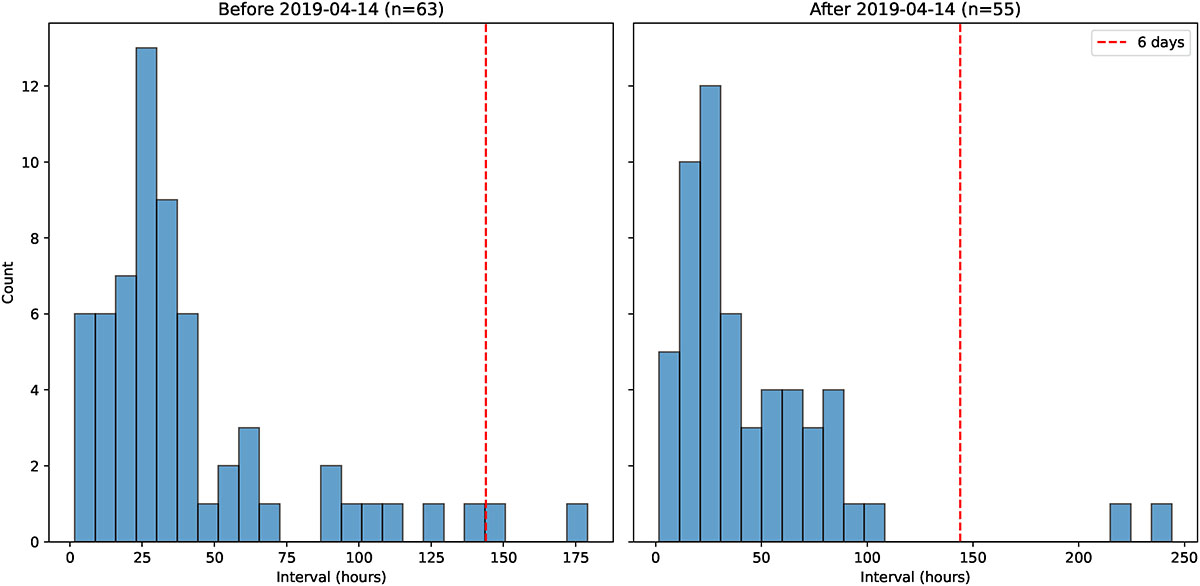
Histogram of sampling intervals distributions of phase 1b (left: first half; right: second half, split at 2019-04-14). The ∼6 day (144 hr) intervals occur only in the first half.
Current usage metrics show cumulative count of Article Views (full-text article views including HTML views, PDF and ePub downloads, according to the available data) and Abstracts Views on Vision4Press platform.
Data correspond to usage on the plateform after 2015. The current usage metrics is available 48-96 hours after online publication and is updated daily on week days.
Initial download of the metrics may take a while.