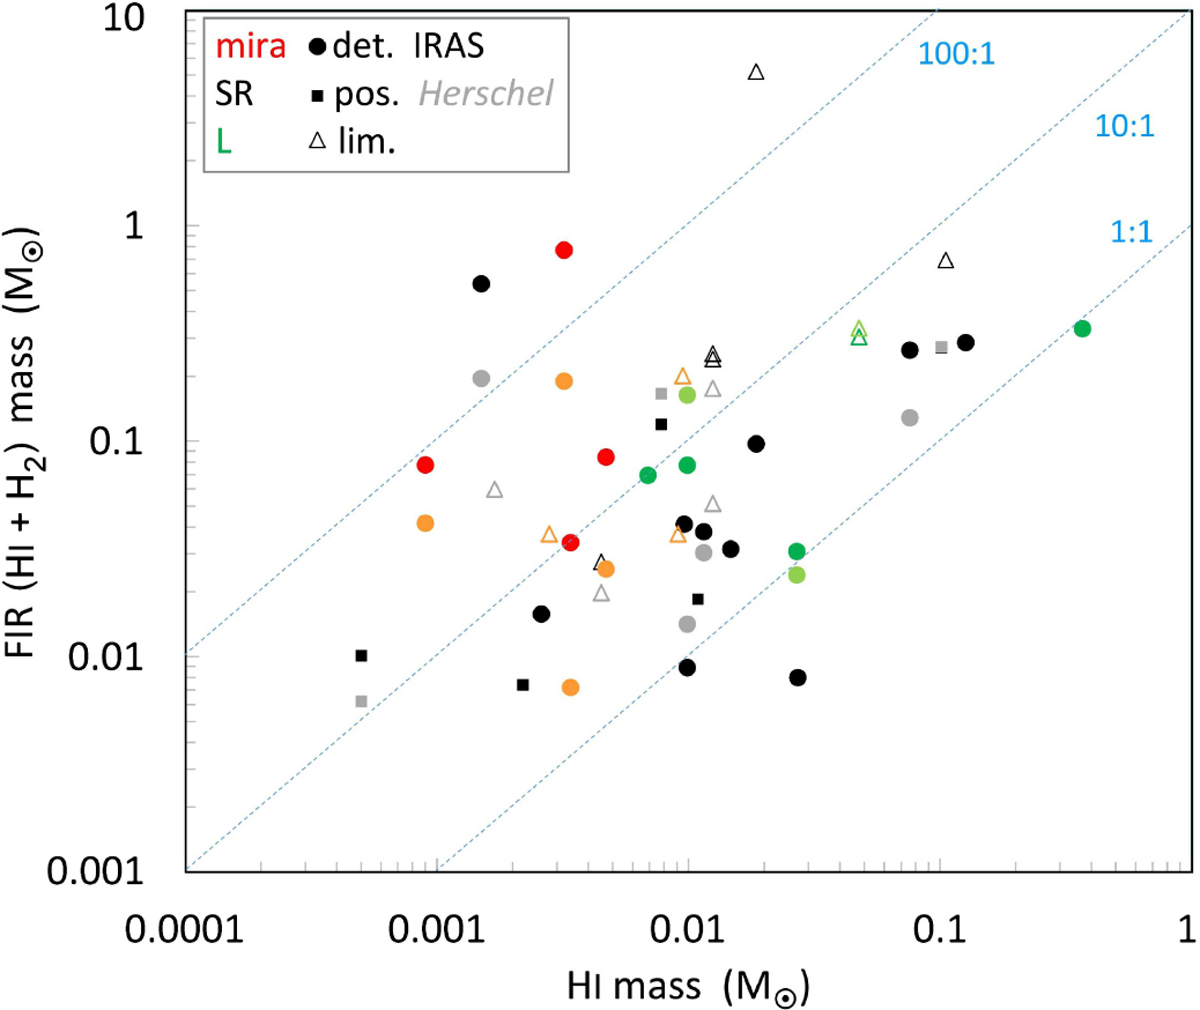
Fig. 2
Download original image
Comparison between FIR total H2 + H I hydrogen masses, MFIR, estimated from FIR data, and total H I masses of AGB star CSEs, both in M⊙. Clear H I detections (det.) are shown as dots, possible detections (pos.) as smaller squares, and upper limits (lim.) as open triangles. Colours indicate different types of variability: red for Miras, black for SR types, and green for L types. FIR masses are based on 60 μm IRAS data or 70 μm Herschel images. The colours of the IRAS data are of a more vivid hue than the Herschel data, such as red vs. orange and black vs. grey. To guide the eye, the three dashed blue lines indicate FIR:H I mass ratios of 100:1, 10:1, and 1:1, respectively.
Current usage metrics show cumulative count of Article Views (full-text article views including HTML views, PDF and ePub downloads, according to the available data) and Abstracts Views on Vision4Press platform.
Data correspond to usage on the plateform after 2015. The current usage metrics is available 48-96 hours after online publication and is updated daily on week days.
Initial download of the metrics may take a while.