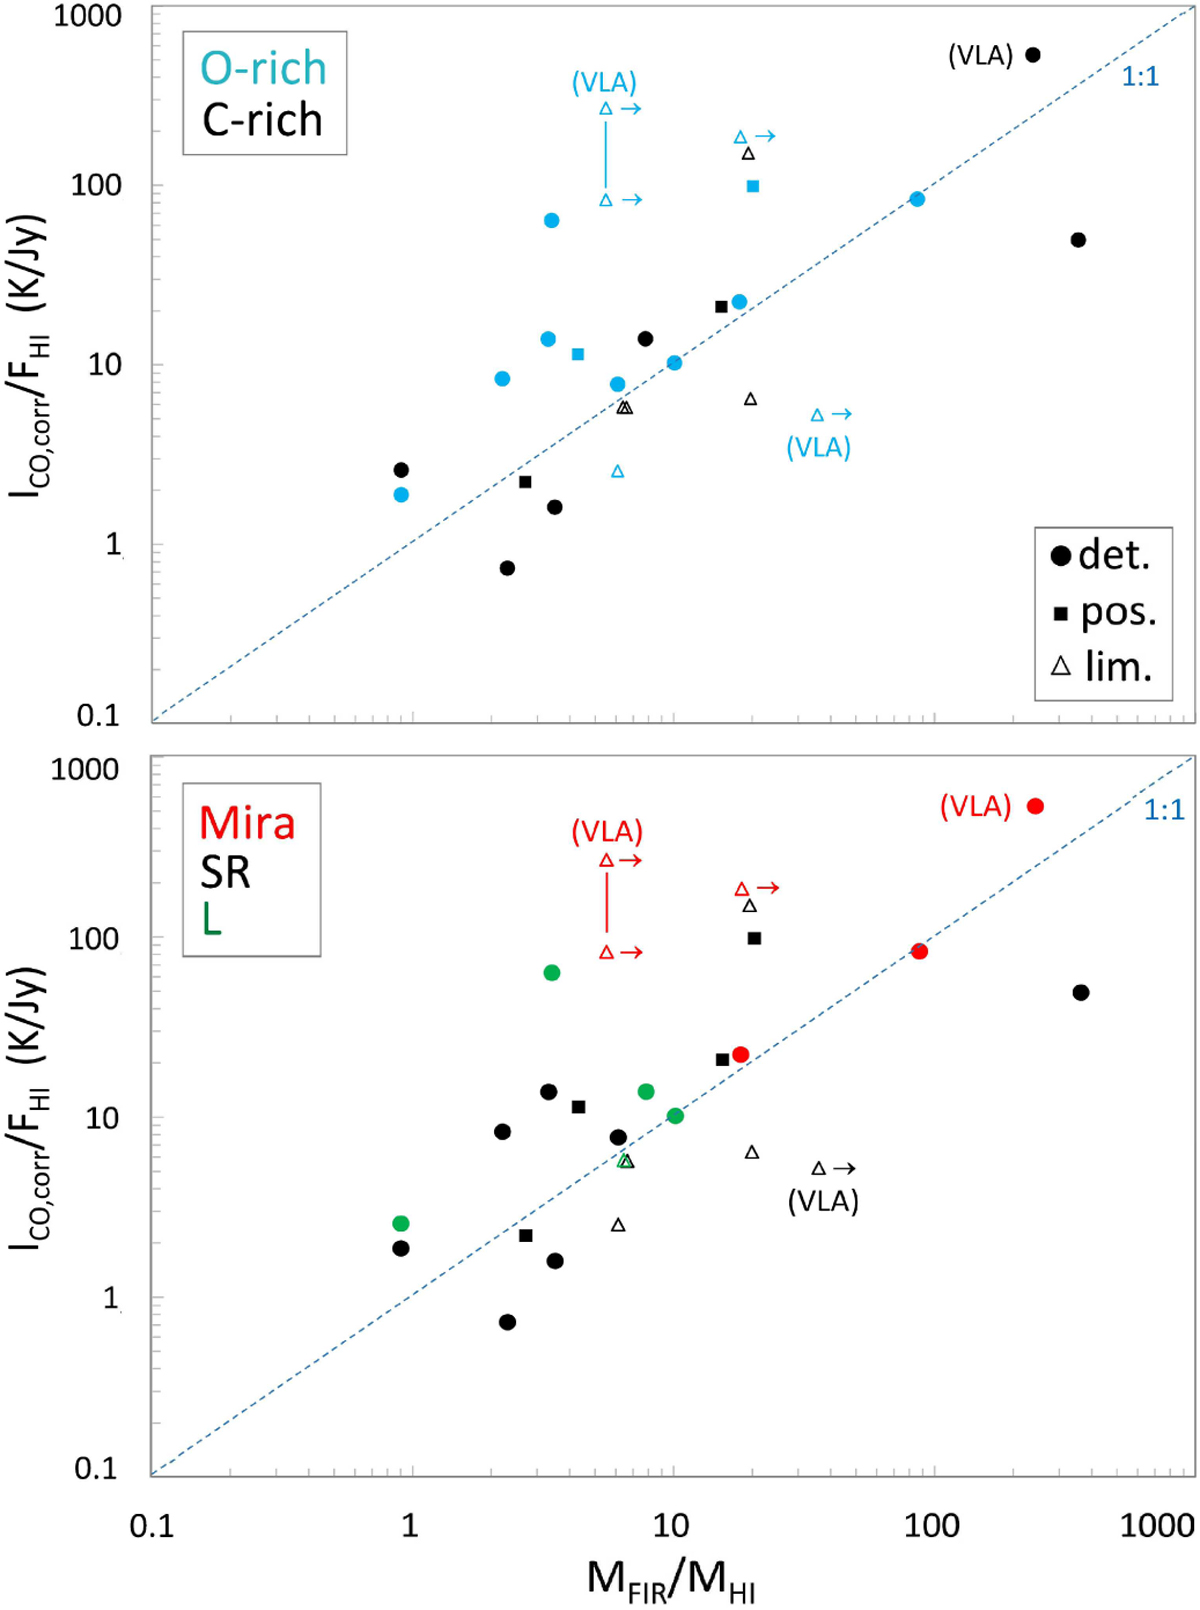
Fig. 3
Download original image
Ratios of CO(1–0) and H I integrated line fluxes, ICO,corr/FHI in K/Jy, as a function of the ratio of FIR (H2 + H I) to H I masses, MFIR/MHI. All published CO fluxes were converted to a telescope diameter of 20 m. Comparisons are shown as a function of chemical composition, C- or O-rich (top panel), and variability: Mira, SR, or L type (lower panel). Clear H I detections (det.) are shown as dots, possible detections (pos.) as smaller squares, and upper limits (lim.) as open triangles. Data points based on H I measurements made with the VLA have been identified. Horizontal arrows indicate points whose MFIR/MHI mass ratios are based on Herschel FIR flux densities, which are systematically lower than IRAS values (see Sect. 4). The colours indicate the various types of objects. Top panel: O-rich (blue), or C-rich (black); lower panel: Mira (red), semi-regular variable (SR, black), and long-period variable (L, green). To guide the eye, a dashed blue line indicates a slope of 1:1 in each panel.
Current usage metrics show cumulative count of Article Views (full-text article views including HTML views, PDF and ePub downloads, according to the available data) and Abstracts Views on Vision4Press platform.
Data correspond to usage on the plateform after 2015. The current usage metrics is available 48-96 hours after online publication and is updated daily on week days.
Initial download of the metrics may take a while.