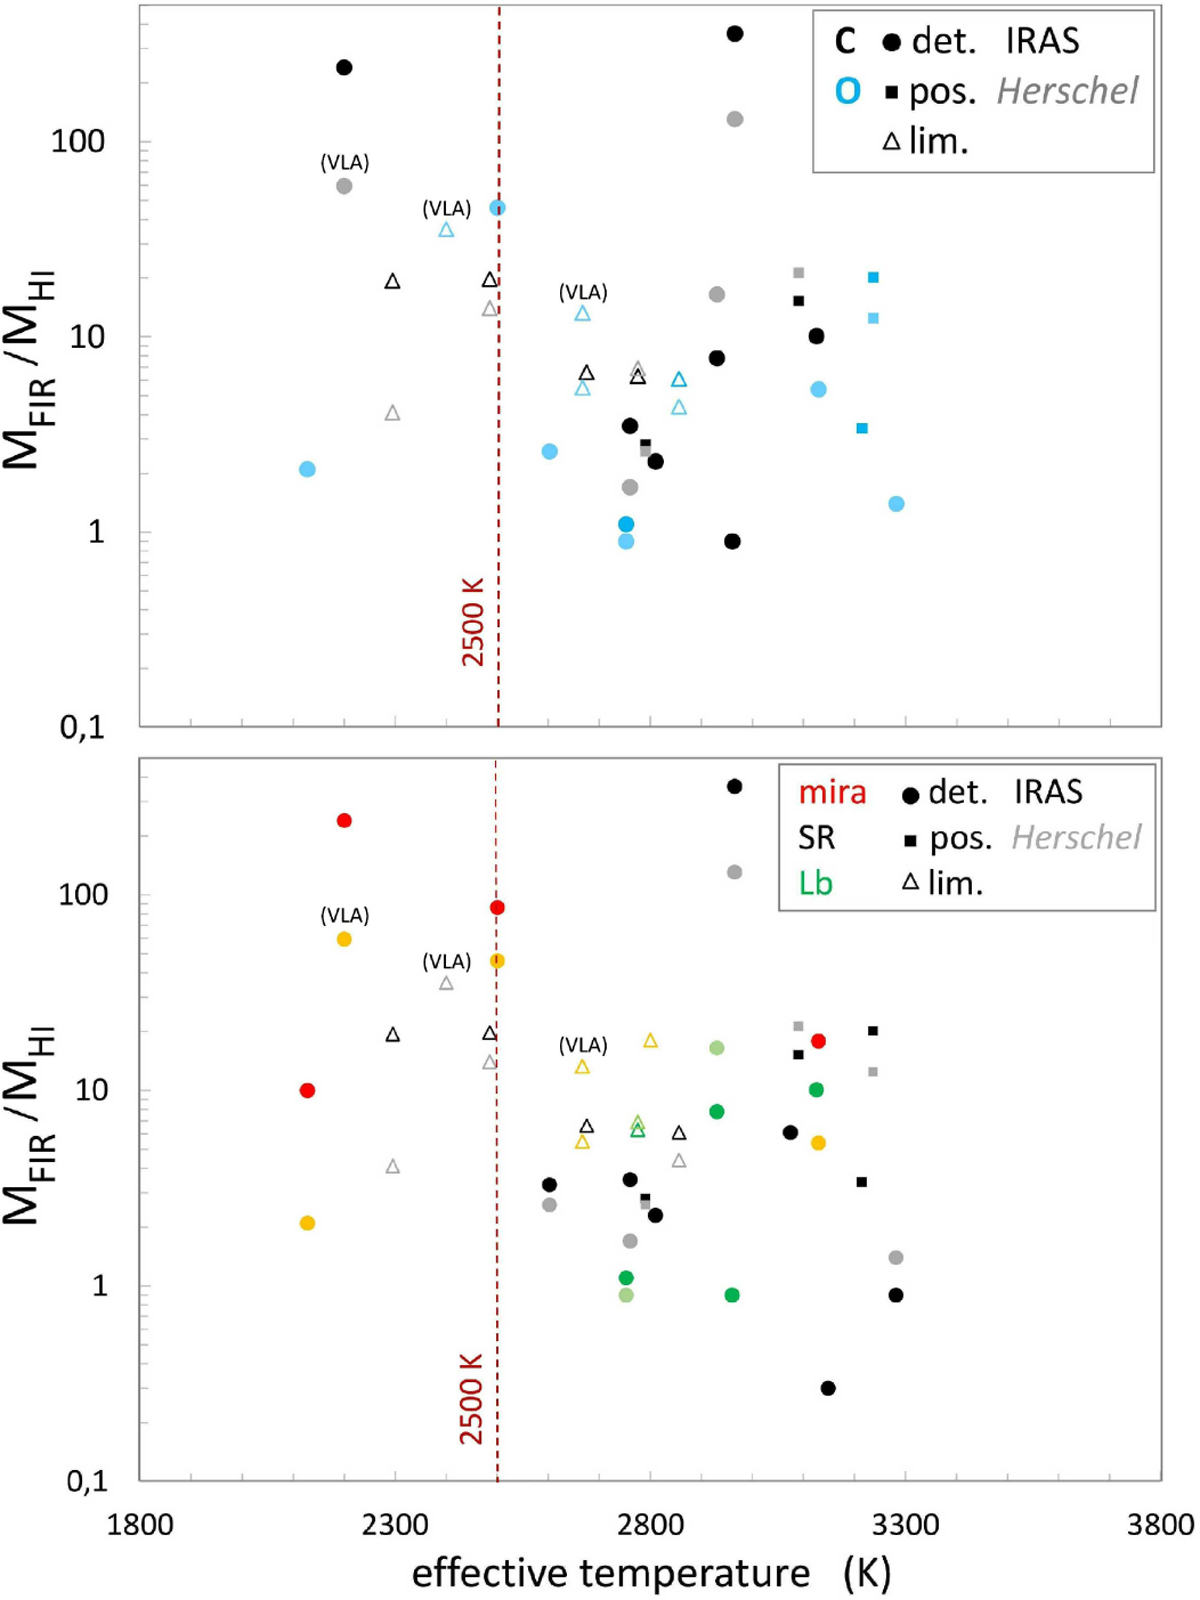
Fig. 4
Download original image
Comparison of the mass fraction of hydrogen that is atomic in the CSEs of AGB stars as a function of stellar effective temperature. The y-axis shows MFIR/MHI, the ratio of the total (molecular plus atomic) hydrogen mass of the CSE (as estimated from FIR measurements; see Sect. 4) to the H I mass of the CSE as measured from H I 21 cm line observations. The x-axis shows Teff, in K. Comparisons are shown as a function of chemical composition of the star (C- or O rich; top panel), and variability class (Mira, SR or L type; lower panel). Clear H I detections (det.) are shown as dots, possible detections (pos.) as smaller squares, and upper limits (lim.) as open triangles. Colours indicate different types of variability: red for Miras, black for SR types, and green for L types. FIR masses are based on 60 μm IRAS data or 70 μm Herschel images. In both panels, the colours of the points where the total hydrogen masses were derived from IRAS data are of a more vivid hue than of the Herschel data, such as red vs. orange and black vs. grey. The red vertical dashed line indicates the 2500 K soft limit around which the H2:H I mass ratio is theoretically predicted to change (see text).
Current usage metrics show cumulative count of Article Views (full-text article views including HTML views, PDF and ePub downloads, according to the available data) and Abstracts Views on Vision4Press platform.
Data correspond to usage on the plateform after 2015. The current usage metrics is available 48-96 hours after online publication and is updated daily on week days.
Initial download of the metrics may take a while.