Open Access
Fig. 5
Download original image
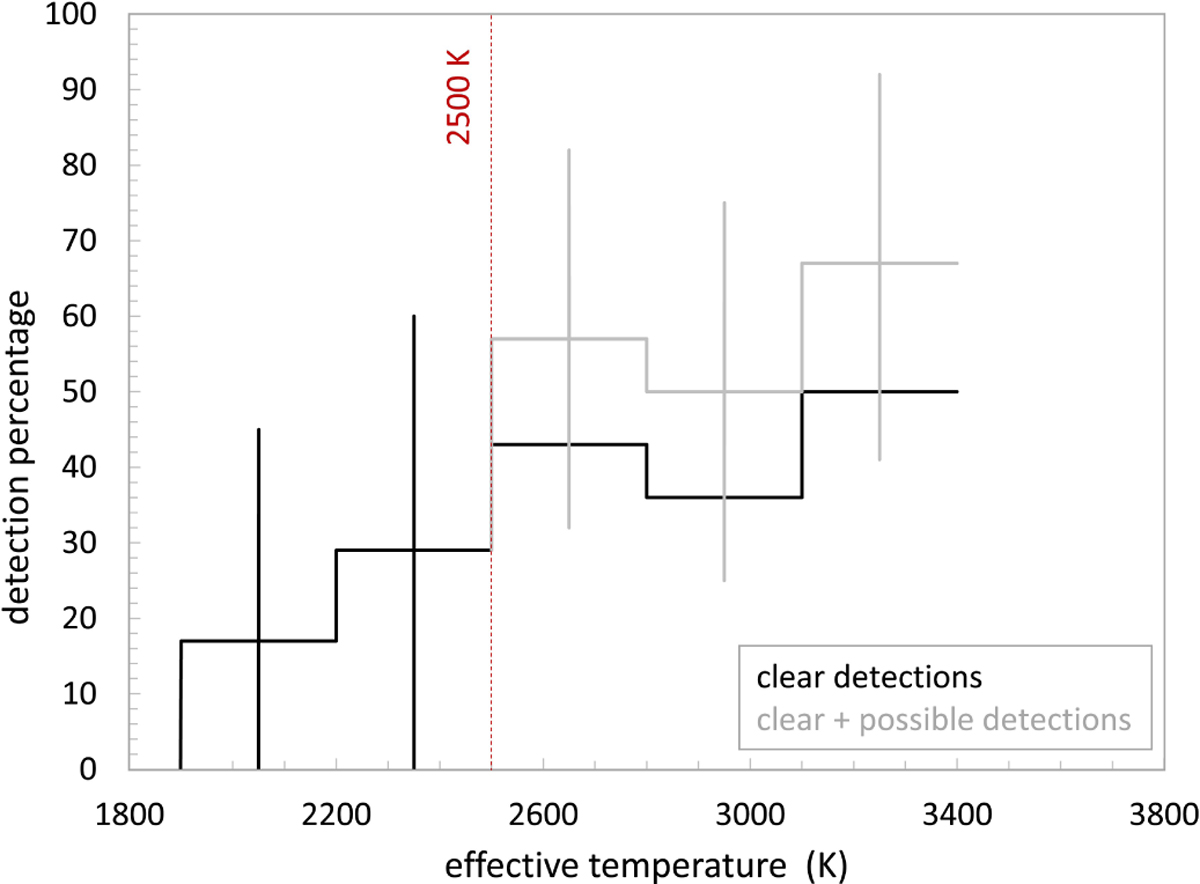
Distributions of H I detection rates as a function of effective temperature of the central star, for clear detections (black line) and for clear + possible detections (grey line), in bins of 300 K width in Teff. The vertical lines indicate statistical uncertainties for a confidence level of 95%.
Current usage metrics show cumulative count of Article Views (full-text article views including HTML views, PDF and ePub downloads, according to the available data) and Abstracts Views on Vision4Press platform.
Data correspond to usage on the plateform after 2015. The current usage metrics is available 48-96 hours after online publication and is updated daily on week days.
Initial download of the metrics may take a while.