Fig. 7
Download original image
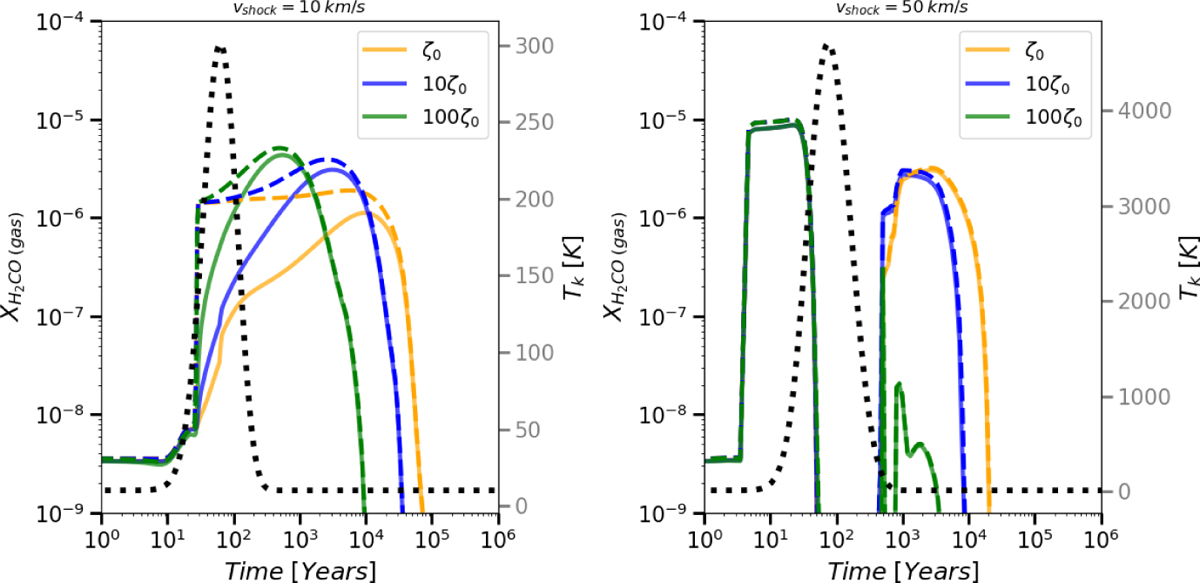
Chemical abundances of gas-phase formaldehyde as a function of time for slow C-shock (left panel) and high C-shock (right panel) models with a pre-shocked gas density volume of nH2 (init) = 105 cm−3. The dashed and solid lines correspond to the default and current schemes, respectively. The evolution of gas temperature, Tk(t), is depicted by the dotted grey line.
Current usage metrics show cumulative count of Article Views (full-text article views including HTML views, PDF and ePub downloads, according to the available data) and Abstracts Views on Vision4Press platform.
Data correspond to usage on the plateform after 2015. The current usage metrics is available 48-96 hours after online publication and is updated daily on week days.
Initial download of the metrics may take a while.