| Issue |
A&A
Volume 704, December 2025
|
|
|---|---|---|
| Article Number | A17 | |
| Number of page(s) | 9 | |
| Section | Interstellar and circumstellar matter | |
| DOI | https://doi.org/10.1051/0004-6361/202556145 | |
| Published online | 28 November 2025 | |
Investigating solid-state CH3OH formation with chemical modelling
1
Leiden Observatory, Leiden University,
PO Box 9513,
2300 RA
Leiden,
The Netherlands
2
Observatorio Astrónomico Nacional, Universidad Nacional de Colombia,
Teusaquillo, Bogotá, Bogota,
Colombia
3
Transdisciplinary Research Area (TRA Matter) and Argelander Institut für Astronomie, Universität Bonn,
Auf dem Hügel 71,
53121
Bonn,
Germany
4
Department of Physics and Astronomy, University College London,
Gower Street, London WC1 E6BT,
UK
★ Corresponding author: This email address is being protected from spambots. You need JavaScript enabled to view it.
Received:
27
June
2025
Accepted:
22
September
2025
Abstract
Context. Recent Monte Carlo simulations and laboratory studies of interstellar ices have proposed an alternative pathway involving the radical-molecule H-atom abstraction reaction in the overall mechanism of methanol (CH3OH) formation in dark molecular clouds.
Aims. A computational study was conducted to investigate the contribution of the radical-molecule H-atom abstraction route in CH3OH formation in interstellar ices, both in non-shocked and shocked environments, and to examine how the physical conditions of the interstellar medium (ISM) affect the overall CH3OH synthesis pathway.
Methods. A set of chemical models were run using the gas-grain chemical code UCLCHEM to systematically explore methanol synthesis in various physical scenarios, including non-shock and low- and high-velocity C-shocks.
Results. This work demonstrates for the first time that, under non-shock and shocked-influenced environments, the primary reaction leading to the formation of methanol in the inner layers of interstellar ices is indeed the radical-molecule H-atom abstraction route. However, such a route is dependent on the gas kinetic temperature (Tk), the gas volume density (nH2), the velocity of the C-shock wave (vshock), and the cosmic ray ionisation rate (ζ). Furthermore, gaseous formaldehyde may trace C-type shocks and serve to differentiate methanol formation pathways in low-velocity C-shocked environments, as its abundance varies more significantly than that of CH3OH with the inclusion of the H-atom abstraction reaction in UCLCHEM. Thus, the XH2CO/XCH3OH ratio represents a potential diagnostic tool for this purpose.
Key words: astrochemistry / ISM: abundances / ISM: clouds / ISM: molecules
© The Authors 2025
 Open Access article, published by EDP Sciences, under the terms of the Creative Commons Attribution License (https://creativecommons.org/licenses/by/4.0), which permits unrestricted use, distribution, and reproduction in any medium, provided the original work is properly cited.
This article is published in open access under the Subscribe to Open model. This email address is being protected from spambots. You need JavaScript enabled to view it. to support open access publication.
1 Introduction
Interstellar methanol is considered an important building block of complex organic molecules (COMs) through surface and gas phase reactions, such as CH2OH radical, CH3O radical, CH3CH2OH (ethanol), CH3OCH3 (dimethyl ether), CH3CHO (methyl formate), (CH2OH)2 (ethylene glycol), and other species (Charnley et al. 1992; Fuchs et al. 2009; Williams et al. 2018). Mathew et al. (2022) discussed how methanol could be the starting material for olefins, carbonyl compounds, amines, amino acids, peptides, polypeptide chains, and complex life molecules such as Ribonucleic Acid (RNA). Hence, it is crucial to investigate and understand the pathways leading to interstellar methanol formation.
The existing framework of interstellar methanol formation involves a vast network of interrelated reactions. Among these, the two formation pathways of most interest are the pure gas phase and the solid-state schemes.
In the gas phase, protonated methanol (CH3OH2+) can be produced by the radiative association reaction, which is primarily activated by cosmic rays or stellar radiation (Rxn. (1)) (Williams et al. 2018; Luca et al. 2002):
![Mathematical equation: $\mathrm{CH}_{3}{ }^{+}+\mathrm{H}_{2} \mathrm{O} \longrightarrow\left[\mathrm{CH}_{3} \mathrm{OH}_{2}{ }^{+}\right]^{*} \longrightarrow \mathrm{CH}_{3} \mathrm{OH}_{2}{ }^{+}+h v.$](/articles/aa/full_html/2025/12/aa56145-25/aa56145-25-eq2.png) (1)
(1)
In this radiative association reaction, the protonated methanol is formed during a highly exothermic reaction, ΔH = −2.9 eV (Luca et al. 2002), where the collision complex, [CH3OH2+]*, is formed in an energetic excited state and then stabilized by emitting a photon. Geppert et al. (2006) argued that in more complicated systems, the radiative lifetime of the excited complex can be of the same order of magnitude as the dissociative lifetime. Therefore, both processes may compete in determining the stability of the excited complex and, thereby, affecting the overall production of protonated methanol. The protonated methanol then dissociatively recombines with electrons to form methanol (Rxn. (2)) (Williams et al. 2018; Geppert et al. 2006; Yamamoto 2017):
![Mathematical equation: $\mathrm{CH}_{3} \mathrm{OH}_{2}{ }^{+}+\mathrm{e} \longrightarrow\left[\mathrm{CH}_{3} \mathrm{OH}_{2}\right]^{*} \longrightarrow \mathrm{CH}_{3} \mathrm{OH}+\mathrm{H}.$](/articles/aa/full_html/2025/12/aa56145-25/aa56145-25-eq3.png) (2)
(2)
This last reaction, at ΔH = −5.7 eV, is one of the few dissociative recombination pathways possible in the gas-phase Interstellar Medium (ISM) due to the low kinetic energies prevailing there (Geppert et al. 2006). Wirström et al. (2011); Geppert et al. (2005), however, had established that the dissociative recombination step, Rxn. (2), could not be efficient enough for a pure gas phase route alone to explain the observed CH3OH abundances.
On the other hand, solid-state methanol is an abundant constituent of ice-type mantles (McClure et al. 2023). In dense and cold regions of molecular clouds, CO molecules present in the gas phase freeze out and form an apolar coating on top of icy-dusty grains (Williams et al. 2018; Chuang et al. 2016, 2018; Linnartz et al. 2015; Santos et al. 2022). Methanol is then efficiently formed through the continuous hydrogenation of CO in the solid phase, with formaldehyde (H2CO) as one of the intermediate products (see the CO hydrogenation mechanism in Table 1).
The CO hydrogenation, which is a Langmuir–Hinshelwood (L−H) mechanism, has been regarded as the primary route to producing methanol in dark molecular clouds. In addition, this process has been shown to effectively reproduce methanol abundances observed in translucent clouds, while pure gas phase models fail by four orders of magnitude (Turner 1998). However, recent laboratory results and Monte Carlo simulations suggest that the radical-molecule H-atom abstraction route (Rxn. (3); Santos et al. 2022; Álvarez-Barcia et al. 2018; Simons et al. 2020), which is also an L-H mechanism, is the dominant (70−90%) final step for forming CH3OH in dark molecular clouds. This pathway replaces the hydrogenation of CH3O in the overall CH3OH formation mechanism (Santos et al. 2022; Álvarez-Barcia et al. 2018; Simons et al. 2020). Santos et al. (2022) suggests that the total contribution of each pathway is determined by the availability of H, CH3O and H2CO in the ice:
 (3)
(3)
In addition, under H2O-rich interstellar ice environments, Qasim et al. (2018) studied the CH3OH formation in ice analogues and found that methanol formation is possible through the sequential surface reaction chain: CH4+OH → CH3+H2O and CH3+OH → CH3OH. In addition, Molpeceres et al. (2021) suggest the possibility that CH3OH could form via C+ H2O in water-rich ices. However, Qasim et al. (2018) conclude that the CO+H reaction pathway is approximately 20 times more effective in producing CH3OH at 10 K compared to the CH4+ OH route. Furthermore, Jiménez-Serra et al. (2025) model the ice chemistry in the Chameleon I molecular cloud using a set of state-of-the-art astrochemical codes and found that CH3OH ice formation occurs predominantly (>99%) via CO hydrogenation, while the contribution of reactions CH3+OH and C+H2O is negligible.
The present work aims to study the main interstellar methanol formation route under non-shocked and shocked scenarios, using the open source gas-grain chemical code UCLCHEM v.3.11 (Holdship et al. 2017). This study explores the influence of the radical-molecule H-atom abstraction route on methanol formation under shock-influenced environments, such as galactic protostellar outflows. In Section 2, we describe the chemical models performed. In Section 3, we assess the importance of gas-phase versus solid-phase methanol formation mechanisms in the framework of outflow observations. In Section 4, we analyse the impact of the radical-molecule H-atom abstraction route on HCO, H2CO, and CH3O. We briefly summarise our findings in Section 5.
Methanol formation reaction rate constants.
2 Chemical modelling of methanol
We used the time-dependent open-source gas-grain chemical model UCLCHEM (Holdship et al. 2017) to model methanol formation in star-forming regions. Several physics modules are available in UCLCHEM. The so-called ‘hot core’ module allowed us to model the envelopes surrounding a forming protostar. In this model, the temperature increases following the time and radially dependent temperature profiles described by Viti et al. (2004) and adapted in Awad et al. (2010). The ‘shock’ modules (C- and J−) are instead used to model shocked regions. For this module, UCLCHEM adopts a parametrized C-shock and J-shock from Jiménez-Serra et al. (2008) and James et al. (2020) respectively, to describe the changes in gas properties over time in the presence of shocks. For this study, we only used the C-shock module.
For the C-shock models, we ran UCLCHEM for three epochs, according to the epoch of shock propagation. The preshock epoch corresponds to the time in which the initial gas kinetic temperature, Tk(t), remains low and is the same as Tk,init. The beginning of the shock is determined by the rise of Tk(t) due to shock heating, and the post-shock epoch is determined by its decrease until it once again reaches the initial cold temperature. For gas-phase chemistry, we used the UMIST12 database (McElroy et al. 2013). The surface network is provided in the UCLCHEM GitHub repository and includes the standard hydrogenation route to methanol from CO. We call this network the ‘standard’ network.
To implement the radical-molecule route (Rxn. (3)) in the UCLCHEM network, we introduced the reaction list given in Table 1. In the added network, we used the branching ratios proposed by Simons et al. (2020) and the barrier energies reported in the KIDA DATABASE (Wakelam et al. 2012) and Álvarez-Barcia et al. (2018) to implement the radical-molecule route into the UCLCHEM network. We refer to this augmented network as the ‘current’ network.
Table 2 summarises the physical conditions used to model the non-shock and shock chemistry in various physical scenarios. We ran 192 models in total, taking into account both default and current networks. The UCLCHEM modelling consists of two stages ordered in time sequence: In stage 1, diffuse gas (initial nH2(init) = 10 cm−3) undergoes free-fall collapse until a density is set by the user (See Table 2). During this stage, the gas evolves from elemental atomic to the composition of a dense cloud. In the second stage, we evolved the chemistry under two scenarios: C-type shocks and ‘hot cores’, with the latter representing dense gas around protostars that has not been shocked.
During the first stage, the gas kinetic temperature of Tk,init = 10 K and the cosmic ray ionisation rate (CRIR) for molecular hydrogen is standard at ζ0=5 × 10⁻¹⁷ s−1. The cloud was allowed to evolve for ∼107 years.
For the C-shock scenario, we varied the CRIR from ζ=ζ0 to ζ=100 ζ0, and the shock velocity (vshock) from 10 to 50 km/s. The chosen range for vshock allowed us to distinguish between a low-velocity shock (10 km/s as a representative value) and a high-velocity shock (50 km/s as a representative value). In high-velocity shocks, sputtering of Si from the grain-core occurs. Meanwhile, the non-shock model was simulated by heating the cloud (composed of a single gas parcel) to a final gas kinetic temperature, defined as the hot-core temperature TH C, set to 50, 100, and 200 K, considering a 10 M ⊙ embedded protostar (Viti et al. 2004). For both shock and non-shock scenarios, the cloud was allowed to evolve for 107 years for the second stage as well.
Range of values for stage 2 variables.
3 Interstellar C H3 O H formation
This section presents a detailed analysis of the behaviour and formation pathways of solid-state methanol, both on the surface and in the inner layers (bulk) of the icy-dusty grain. The aim of this analysis is to verify whether the implemented radical-molecule H-atom abstraction reaction does become the dominant final step in forming solid-state CH3OH, as stated in Simons et al. (2020) and Santos et al. (2022). The term ‘ice phase’ used below refers to the combined contribution of the grain surface and bulk.
In non-shock scenarios, the abundance of methanol in the ice remains stable throughout the model until 105 yr. Any subsequent decrease, as Tk(t) reaches 200 K, is attributed to cosmic rays or thermal desorption. However, when a C-shock is present, regardless of its velocity, there is a significant decrease in the abundance of the ice phase as the shock propagates (see left panel in Fig. 1). The destruction of ice layers during the propagation of the C-shock wave results in the release of methanol from the solid to the gas phase, leading to a significant decrease in solid-state methanol abundance. As the C-shock wave dissipates, ice mantles begin to re-form, and methanol gradually re-accumulates in the solid phase as new layers grow on the grain surfaces, enhancing the abundance of solid-state methanol (see right panel in Fig. 1). The behaviour of CH3OH in the solidstate changes when a C-shock propagates, so it is pertinent to analyse the reactions that form CH3OH, both on the surface and in the bulk of the grain, and whether the overall CH3OH synthesis pathway varies according to the gas kinetic temperature (Tk), the gas volume density (nH2), the velocity of the C-shock wave (vshock), and the CRIR (ζ). The following subsections analyse each CH3OH state and the differences between the most important reactions at different time steps.
3.1 Grain-surface phase
In non-shock models, surface methanol (see left panel in Figure 2) is still primarily formed through the hydrogenation of CH3O (Rxn.(4)) and CH2OH (Rxn. (5)). The prevalence of hydrogenations may stem from the fact that these H-atom addition routes are promoted with a higher H-atom flux to the surface, allowing the accreted H-atoms to diffuse and react with both CH3O and CH2OH species. Methanol synthesis through CH3O or CH2OH hydrogenation is a process that has no barriers (Santos et al. 2022), making it ideal for enhancing methanol production at such low temperatures. Once Tk(t)=THC, condensation of gaseous CH3OH and CH3OH2+ (Rxn. (6)) ascribe to the surface methanol formation:
 (4)
(4)
 (5)
(5)
 (6)
(6)
However, the formation of surface methanol during a shock involves an additional series of reactions. The H-atom addition reactions are replaced by the H-abstraction route (Rxn. (7); Simons et al. 2020) as Tk(t) rises in low-velocity C-shocks, while bulk-to-surface transfer dominates at the maximum Tk(t):
 (7)
(7)
The main difference between the default and current networks is the prevalence of the radical-molecule H-atom abstraction route as Tk(t) increases in low-velocity shocks. In the current network, methoxy radical hydrogenation dominates as the final step in the overall CO hydrogenation mechanism on the grain surface. However, as the temperature rises due to shock heating, the abstraction route replaces radical CH3O hydrogenation as the final step in CH3OH formation. Hence, the methanol yield from both networks is dependent on the surface temperature. Santos et al. (2022) and Simons et al. (2020) show that there is a competition between the increase in the diffusion of H atoms and the decrease in their residence time on the ice as a function of temperature. At low temperatures, CH3O surface radicals undergo hydrogenation. However, as the temperature exceeds 20−30 K, the residence time of H atoms on the surface decreases substantially. At the same time, radicals become mobile, allowing the abstraction reaction to compete with CH3O radical hydrogenation.
This finding seems to contradict the results from Simons et al. (2020) and Santos et al. (2022). The former finds that the CH3O+H pathway becomes significant only at higher temperatures (although their study only covers temperatures up to 20 K) and when the surface coverage of H2 is low. The latter reports experimental evidence suggesting that the abstraction mechanism may already dominate at lower temperatures (10−16 K). However, their study does not distinguish between surface and bulk ice chemistry in the same way as the present model. This disagreement may stem from various reasons: (i) incomplete surface networks in our model; (ii) our different treatment of the surface of the grains where we distinguish between bulk and surface; and (iii) the different physical conditions such as density and temperature ranges. The latter in particular increases extremely fast in our shock models, and the high temperature lasts for a very short time before returning to 10 K.
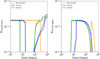 |
Fig. 1 Chemical abundances of ice-phase methanol (left panel) and gas-phase methanol (right panel) as a function of time in non-shocked, slow C-shock (10 km/s) and high C-shock (50 km/s) models with a pre-shocked gas density volume of nH2 (init) = 104 cm−3 and ζ= ζ0. The dashed and solid lines correspond to the default and current schemes, respectively. |
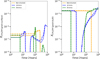 |
Fig. 2 Chemical abundances of surface-phase methanol (left panel) and bulk-phase methanol (right panel) as a function of time in non-shocked, slow C-shock (10 km/s) and high C-shock (50 km/s) models with a pre-shocked gas density volume of nH2 (init) = 104 cm−3 and ζ= ζ0. The dashed and solid lines correspond to the default and current schemes, respectively. |
3.2 Grain-bulk phase
As Tk(t) increases in both non-shock and shocked models (see right panel in Fig. 2), methanol is primarily formed through the hydrogenation of CH3O (Rxn. 8 (Simons et al. 2020), the radical-molecule route (Rxn.(9) (Simons et al. 2020), and surface-to-inner layer transfer. Transfer from surface to inner layers and the hydrogenation of CH3O dominate until Tk(t) ∼70 K at nH2 (init) = 103 cm−3, after which the H-abstraction route takes over. At nH2 (init) ≥ 104 cm−3, the primary methanol formation routes are the H-abstraction reaction and surface-to-inner layer transfer:
 (8)
(8)
 (9)
(9)
The radical-molecule H-atom abstraction route dominates the formation of methanol in the bulk, with the gas density being the most influential factor. High nH2 favours the formation of H2 and OH on the grain surface (Rxns. (10) (Cazaux & Tielens 2004), (11) (Simons et al. 2020), and (12) (Wakelam et al. 2012)), which accumulates in the bulk as new surface layers form. Due to its high reactivity, the H atom reacts with CO and O to primarily form H2O and H2CO in the bulk grain (Rxns. (13) (Simons et al. 2020), (14) (Simons et al. 2020), and (15) (Wakelam et al. 2012)). The H atoms must diffuse in order to react with the minor ice component, CH3O radicals. Therefore, the dominance of the radical-molecule route is likely due to the greater availability of H2CO in the bulk, compared to H atoms, for reacting with CH3O, as stated in Santos et al. (2022):
 (10)
(10)
 (11)
(11)
 (12)
(12)
 (13)
(13)
 (14)
(14)
 (15)
(15)
3.3 Ice phase
In our model the hydrogen abstraction reaction is more relevant in the bulk phase of the ice mantle, whereas Simons et al. (2020); Santos et al. (2022); Jiménez-Serra et al. (2025) present their results in terms of the grain-surface mantle or the ice grain without explicitly distinguishing between the surface and the interior, as we do by defining the former as the outermost layer and the latter as everything beneath the surface. Since we consider the grain to be largely composed of bulk material, we can extend our observation to the ice phase in general.
Simons et al. (2020) performed a series of simulated co-depositions of CO+H and H2CO+H considering different H− atom binding energies (250 K, 420 K, and 670 K). In their simulations, the authors found that the radical-molecule route is the primary pathway for methanol formation. They emphasised the dependence of CH3OH formation on the H: CO ratio. They also pointed out that the dominance of the H-abstraction reaction arises because when two H2CO molecules are produced nearby, only one H atom is required for hydrogenation to convert CH3O into CH3OH and HCO. Subsequently, these species underwent rapid hydrogenation once more.
On the other hand, Santos et al. (2022) conducted experiments under ultra-high vacuum conditions and astronomically relevant temperatures. They employed H:H2CO (or D2CO) flux ratios of 10:1 and 30:1. Similar to Simons et al. (2020), Santos et al. (2022) observed that the radical-molecule route was the predominant pathway for methanol formation in their experiments. They specifically tested an H/H2CO (D2CO) ratio of 30 at 10 K and concluded that the CHD2OH/CH3OH ratios were negligibly different, considering the detection error. Consequently, Santos et al. (2022) suggested that a higher hydrogen flux only slightly affects the contribution of the radical-molecule H-atom abstraction route, even though a potentially higher H flux might favour the atom-addition route, which still governs the formation of CH3OH. Our results confirm the last statement in the range of nH2 (init) = 104−106 cm−3. In this range, the H-abstraction route dominates and produces similar methanol abundances. Therefore, the product yield is limited by the abundance of formaldehyde rather than the abundance of hydrogen atoms, which are in excess. These results also support the findings of Santos et al. (2022), where the contribution from each route is determined by the availability of hydrogen, formaldehyde, and methoxide radicals in the ice. In an H-abstraction reaction, the probability of the two reactants coming into contact is higher compared to a barrier-less hydrogenation reaction.
Santos et al. (2022) reports that the abstraction route accounts for approximately 80% of the contributions in the 10−16 K interval, which is consistent with the findings of Simons et al. (2020). In both studies, CH3OH formation is independent of temperature in the 10−16 K range. Moreover, our results indicate that the H-abstraction reaction is the dominant final step in the CO hydrogenation to form CH3OH, both at low gas kinetic temperatures, such as those found in molecular clouds, and at high gas kinetic temperatures, such as those achieved by shock heating, under nH2 (init) = 104−106 cm−3. Quantum tunnelling is activated at low temperatures, but as the temperature rises, it may also become thermally activated. This last scenario is most commonly observed under low nH2 (init), where elevated temperatures could promote the radical-molecule route.
We note that in Jiménez-Serra et al. (2025), multiple models were run utilising various astrochemical codes to analyse the ice abundances recorded by JWST during the Ice Age Early Release Science programme (McClure et al. 2023), focusing on the heavily obscured background stars NIR38 and J110621 in the line of sight of the dense molecular cloud Chameleon I. In the stochastic kinetic Monte Carlo (KMC) simulations (Cuppen & Herbst 2007), which examine the H-abstraction pathway for the synthesis of CH3OH, it was determined that methanol is primarily produced via the sequential hydrogenation of CO. The simulations indicated that approximately 60% of methanol is primarily derived from the hydrogenation of CH2OH, which was not classified as a formation reaction since CH2OH is exclusively generated through H-abstraction of methanol. Around 30% is produced via the hydrogenation of CH3O, while the radical-neutral reaction CH3O+H2CO → CH3OH+HCO contributes only about 10%. The discrepancies may arise from the varying grid of conditions employed in both studies (e.g. reduced extinction usage in this research).
In terms of CRIR, cosmic ray-induced photons can dissociate H2CO and CH3OH, producing functional group radicals such as CH3 and CH3O on or within the ice. Our results also suggest that high CRIR (ζ=100 ζ0) decreases the abundance of methanol in all phases. However, this rate affects both the radical-molecule route and other possible pathways, as the energy from cosmic rays can break apart precursor molecules involved in the overall CO hydrogenation mechanism before they can react.
Figure 3 shows that in low-velocity C-shocks, ice methanol is more abundant when using the default network compared to the current one. The main difference between the two networks is that the H-abstraction reaction is the primary pathway for methanol formation in the bulk, whereas the CH2OH hydrogenation on the grain surface has become more significant due to changes in branching ratios, especially at higher Tk(t). With the current network, we used branching ratios from Simons et al. (2020). These rates were based on quantum chemical calculations combined with a microscopic KMC simulation and yield a lower but proper amount of methanol. It should be noted that the predicted difference in bulk methanol abundance between networks is minimal ( ) because our network does not include other reactions (i.e. HCO+HCO reactions; Simons et al. 2020) that could also alter the molecular composition of the grain mantle. Therefore, we encourage extending the chemical reaction network to enhance completeness in future studies.
3.4 Comparison with observations
It is of interest to ascertain whether modifying the solid-state reaction network would have a direct effect on the formation of CH3OH(g) by introducing different abundances in the gas phase.
As mentioned in Huang et al. (2024) and Huang & Viti (2023), gas-phase methanol is a potential tool to trace C-type shocks, as shocks can substantially enhance the gas-phase abundance of CH3OH. Therefore, we aim to analyse whether the changes in the solid-phase formation pathway alter the observable abundance of gas-phase methanol as the shock sputters the grain during its propagation.
Gas-phase methanol is mainly due to CH3O hydrogenation and subsequent chemical desorption (Rxn. (16); Simons et al. 2020; Minissale et al. 2016), with an important contribution from CH2OH hydrogenation (Rxn. (17); Simons et al. 2020; Minissale et al. 2016) in the models at nH2 (init) = 103 cm−3. As the gas kinetic temperature increases due to shock heating, the hydrogenation of CH3O is replaced by multiple reactions such as ion-neutral Rxn. (18) (Sung Lee et al. 1992), protonated methyl alcohol (CH3OH2+) recombination in Rxn. (19) (Geppert et al. 2006), and the ion-neutral Rxn. (20) (Wakelam et al. 2012):
 (16)
(16)
 (17)
(17)
 (18)
(18)
 (19)
(19)
 (20)
(20)
However, the radical-molecule route, Rxn. (21) (Simons et al. 2020; Minissale et al. 2016; Santos et al. 2022), has an impact on gaseous methanol production only at low-velocity C-shocks with high initial gas volume densities (nH2 (init) = 105−106 cm−3):
 (21)
Therefore, it is pertinent to contrast our UCLCHEM models with galactic protostellar outflow observations made by Holdship et al. (2019) to ascertain whether it would be possible to observationally distinguish the most favourable pathways for CH3OH(s) formation under shock-induced environments.
(21)
Therefore, it is pertinent to contrast our UCLCHEM models with galactic protostellar outflow observations made by Holdship et al. (2019) to ascertain whether it would be possible to observationally distinguish the most favourable pathways for CH3OH(s) formation under shock-induced environments.
Class 0 young stellar objects, such as NGC 1333-IRAS2A and NGC 1333-IRAS4A, are associated with outflows. These outflows create shocks upon impacting the surrounding medium (van Dishoeck & Blake 1998; Holdship et al. 2019). As Holdship et al. (2019) observed, these shock regions showcase a diverse chemistry, with gas-phase methanol experiencing notable increases in abundance. In order to model the physical structure traced by CH3OH in the protostellar outflow sources – IRAS2A-R, IRAS2A-B, IRAS4A-R, and IRAS4A-B – we used the inferred gas properties (nH2 (init)) from Holdship et al. (2019). Our grid of models includes these inferred gas properties to study the influence of formation pathways (processing of interstellar ices and pure gas-phase mechanisms) on the observed interstellar methanol abundances.
To effectively compare the models with observations, we focus on those with an abundance exceeding XCH3OH = 10−7 and a ratio between the standard and the current networks of  . For gas-phase methanol, only the model with nH2 (init) = 105, ζ=ζ0, and vshock=20 km/s fulfils both characteristics at the same time. Figure 4 illustrates a comparison of gas-phase methanol column densities over time using 10−50 km/s models with the range of methanol column densities reported by Holdship et al. (2019) for IRAS2A-R, IRAS2A-B, IRAS4A-R, and IRAS4A-B. In order to compare our models directly with the observations, we derived column densities from the modelled fractional abundances by using the on-the-spot approximation:
 (22)
where AV is the visual extinction, N(H2) is equal to 1.6 × 1021 cm−2, and the hydrogen column density corresponds to AV= 1 mag.
(22)
where AV is the visual extinction, N(H2) is equal to 1.6 × 1021 cm−2, and the hydrogen column density corresponds to AV= 1 mag.
As seen in Fig. 4, when comparing the models with the range of methanol column densities recorded by Holdship et al. (2019), and assuming the same Av in both models and observations, it is not possible to establish which formation pathway is dominant, since both networks yield methanol abundances that are within the observed range.
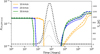 |
Fig. 3 Chemical abundances of ice-phase methanol as a function of time in slow C-shock (10−20 km/s) and moderately high C-shock (30 km/s) models with a pre-shocked gas density volume of nH2 (init) = 104 cm−3 and ζ=ζ0. The dashed and solid lines correspond to the default and current schemes, respectively. The evolution of gas temperature, Tk(t), is depicted by the dotted grey lines. |
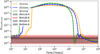 |
Fig. 4 Column densities of gaseous CH3OH as a function of time for slow C-shock (10−20 km/s) and high C-shock (50 km/s) models with a pre-shocked gas density volume of nH2 (init) = 105 cm−3 and ζ=ζ0. The dashed and solid lines correspond to the default and current schemes, respectively. The hatches represent the range in the CH3OH column density reported by Holdship et al. (2019) for IRAS2A-R, IRAS2A-B, IRAS4A-R, and IRAS4A-B. |
4 Impact of H-abstraction route on precursors
The addition of a new route in the chemical network has a significant impact on the immediate methanol precursors, CH3O and H2CO, as well as the by-product HCO, particularly in the ice phase. Since the three molecules are significantly affected by shock scenarios, we discuss below their shock behaviour and the way in which the radical-molecule reaction affects their overall chemical pathway over time.
Generally speaking, in both low- and high-velocity shocks, as well as in default and current networks, the solid abundances of HCO, H2CO, and CH3O drop dramatically (below 10−15) as the shock wave propagates. Similar to methanol, their solid-state abundances increase again once the shock wave dissipates. We discuss each precursor below.
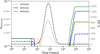 |
Fig. 5 Chemical abundances of ice-phase HCO as a function of time in slow C-shock (10−20 km/s) and moderately high C-shock (30 km/s) models with a pre-shocked gas density volume of nH2 (init) = 104 cm−3 and ζ=10 ζ0. The dashed and solid lines correspond to the default and current schemes, respectively. The evolution of gas temperature, Tk(t), is depicted by the dotted grey line. |
4.1 Formyl radical (HCO)
The formation of HCO(bulk) is influenced by the insertion of the H-abstraction route into the chemical network. In scenarios with or without shock, HCO(bulk) formation is attributed to reactions (23) (Simons et al. 2020) and (24) (Fedoseev et al. 2016), as well as the H-abstraction reaction. The latter is the preferred reaction at nH2 (init) = 104 cm−3, while in other models, especially at higher nH2, its importance grows as Tk(t) increases:
 (23)
(23)
 (24)
(24)
With respect to HCO, in models with ζ=10 ζ0 and  is observed during the post-shock epoch of low-velocity C-shocks (vshock=10−20 km/s) and moderately high-velocity C-shocks (vshock=30 km/s). When comparing the abundance of ice formyl radicals between networks (see Fig. 5), it is generally observed that the current network predicts a higher HCO abundance:
  , when XHCO(ice) exceeds 10−7. This is because HCO is a by-product in the radicalmolecule route. The HCO radical is an important astrochemical building block due to its ability to synthesise bio-relevant COMs, such as glycolaldehyde, ethylene glycol, and methyl formate (Woods et al. 2013; Simons et al. 2020; Li et al. 2022; Santos et al. 2022). Therefore, this new reaction must be considered in the overall ice-grain chemical network, as it influences the abundance of formyl radicals and hence the distribution of COMs in the ISM.
4.2 Formaldehyde (H2CO)
In non-shock and shocked scenarios, the H-abstraction reaction dominates the H2CO destruction in the grain bulk from nH2 (init) = 104 cm−3 onwards, becoming more prevalent as Tk(t) increases. The ratio  increases with density, reaching values greater than 2, particularly in the post-shock epoch of the model with nH2 (init) = 106 cm−3, vshock=10 km/s, and ζ=ζ0 conditions, where
  (see Fig. 6). It is generally observed that as nH2 (init) increases in the default scheme, the amount of solidstate formaldehyde increases compared to the current networks:
  , when XH2CO(ice) exceeds 10−7. This difference arises from the faster radical-molecule rate, which results in more formaldehyde being converted to ice methanol and hence consequently a lower H2CO abundance in the current scheme.
Formaldehyde may serve as a tool for tracing C-type shocks and distinguishing between methanol formation pathways in low-velocity shocked environments. At a shock velocity of 10 km/s, gaseous H2CO is enhanced by the shock and traces its full extent. However, in models with nH2 (init) = 103 cm−3 and ζ=100 ζ0, and in all models where vshock is 50 km/s, it is initially enhanced by the shock but subsequently destroyed as the shock raises the gas kinetic temperature. Interestingly, we can identify C-shock velocities by examining the behaviour of methanol and formaldehyde. Formaldehyde serves as a shock tracer when destroyed at high shock velocities, while methanol is enhanced by the shock and traces its full extent. Therefore, the ratio of these two species may be a good shock diagnostic.
In general, gaseous formaldehyde seems to be a great species to discern between methanol formation routes. High density (nH2 (init) = 105−106 cm−3) and low-velocity C-shock (vshock= 10 km/s) models show significant contrast between the default and current networks, with  (Fig. 7). In non-shock models, the difference becomes noticeable as the temperature increases, exceeding 2.5 as the temperature stabilizes. In addition, and of critical importance, the observed abundance ratio of H2CO/CH3OH may distinguish between methanol formation pathways in low-velocity shocked environments.
Similarly to our approach with gaseous methanol, we modelled the physical structure traced by H2CO in the protostellar outflow sources IRAS4A-R and IRAS4A-B, using the initial gas densities (nH2:(init)) inferred by Gómez-Ruiz et al. (2016). Figure 8 presents a comparison of gas-phase H2CO column densities over time from 10−50 km/s models with the lower limits calculated assuming a gas temperature of 20 K, as reported by Gómez-Ruiz et al. (2016), for both IRAS4A-R and IRAS4A-B. As seen, it remains unclear which formation pathway is dominant, as both networks yield formaldehyde abundances that fall within the observed range.
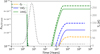 |
Fig. 6 Chemical abundances of ice-phase H2CO as a function of time for slow C-shock models with a pre-shocked gas density volume of nH2 (init) = 106 cm−3 and vshock=10 km/s. The dashed and solid lines correspond to the default and current schemes, respectively. The evolution of gas temperature, Tk(t), is depicted by the dotted grey line. |
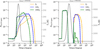 |
Fig. 7 Chemical abundances of gas-phase formaldehyde as a function of time for slow C-shock (left panel) and high C-shock (right panel) models with a pre-shocked gas density volume of nH2 (init) = 105 cm−3. The dashed and solid lines correspond to the default and current schemes, respectively. The evolution of gas temperature, Tk(t), is depicted by the dotted grey line. |
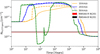 |
Fig. 8 Column densities of gaseous H2CO as a function of time for slow C-shock (10−20 km/s) and high C-shock (50 km/s) models with a pre-shocked gas density volume of nH2 (init) = 105 cm−3 and ζ=ζ0. The dashed and solid lines correspond to the default and current schemes, respectively. The hatches represent the range in the H2CO column density reported by Gómez-Ruiz et al. (2016) for IRAS4A-R and IRAS4A-B. |
4.3 Methoxyl radical (CH3O)
From nH2 (init) = 104 cm−3 onwards, the radical-molecule route (Rxn. (9)) and layer transfer are the primary destruction reactions for CH3Obulk. For most time steps, the current network in general produces more methoxyl radical, due to the change in branching ratios. We observe that as the vshock increases, the abundance of CH3O(bulk) becomes greater compared to the default network, with a  (see Fig. 9).
Finally, the largest ratios are observed at grain formation following the cessation of shock influence. It can be reasonably assumed that enhancing the resolution will enable us to distinguish the preferred route of methanol formation throughout the formation and growth of the grain, particularly in its precursors, by allowing us to detect smaller fluctuations and gain deeper insights into the processes that drive molecular evolution in space. For instance, it is anticipated that by improving the resolution of the observations, the ∼10% increase in HCO(ice) seen in the models at nH2 (init) = 104 cm−3 can be contrasted.
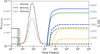 |
Fig. 9 Chemical abundances of ice-phase CH3O as a function of time for C-shock models with a pre-shocked gas density volume of nH2 (init) = 106 cm−3 and ζ=ζ0. The dashed and solid lines correspond to the default and current schemes, respectively. The evolution of gas temperature, Tk(t), is depicted by the dotted grey lines. |
5 Conclusions
We theoretically investigated the impact of the radical-molecule H-atom abstraction route in methanol formation under shock-influenced environments. We confirm that, using the chemical model UCLCHEM, the radical-molecule pathway is the most favoured reaction for the final step in the overall CO hydrogenation mechanism leading to CH3OH formation in the bulk-phase of interstellar ices. This finding is consistent with that of Simons et al. (2020) and Santos et al. (2022). However, its dominance is dependent on the gas kinetic temperature Tk, the gas volume density nH2, the velocity of the C-shock wave vshock, and the CRIR ζ.
Considering the radical-molecule route or changes in the branching ratios within the chemical network does not affect the ability of CH3OH to trace C-shocks. This is because, in both schemes, the increase in gaseous CH3OH abundance is achieved by releasing CH3OH from the solid state into the gas phase through sublimation and sputtering.
Incorporating the radical-molecule H-atom abstraction route into chemical networks has a substantial impact on the abundance of the methanol precursors, CH3O and H2CO, as well as on the abundance of the by-product HCO. The change in the abundance of these chemical species upon introducing the reaction is more significant than the change observed for CH3OH, particularly in the ice phase.
Gaseous formaldehyde may serve as a tool for tracing C-type shocks as well as differentiate between methanol formation pathways in low-velocity C-shocked environments, as its abundance undergoes a more significant change than that of CH3OH when the H-atom abstraction reaction is included in UCLCHEM’s chemical network. Consequently, the abundance ratio  could serve as a useful diagnostic tool for distinguishing between methanol formation pathways in these environments.
Acknowledgements
We acknowledge the very helpful comments from an anonymous referee which led to an improvement of this manuscript. This work is financially supported by advanced ERC funding (grant ID: 833460, PI: Serena Viti) within the framework of MOlecules as Probes of the Physics of EXternal (MOPPEX) project. EMR gratefully acknowledges the Leiden/ESA Astrophysics Program for Summer Students (LEAPS) 2022, organised by Leiden University and the European Space Agency, and the support provided by the Erasmus+ ICM Grant and Observatorio Astronómico Nacional de Colombia. The project leading to this publication was initiated within the framework of this programme.
References
- Álvarez-Barcia, S., Russ, P., Kästner, J., & Lamberts, T., 2018, MNRAS, 479, 2007 [Google Scholar]
- Awad, Z., Viti, S., Collings, M. P., & Williams, D. A., 2010, MNRAS, 407, 2511 [Google Scholar]
- Cazaux, S., & Tielens, A. G. G. M., 2004, ApJ, 604, 222 [NASA ADS] [CrossRef] [Google Scholar]
- Charnley, S. B., Tielens, A. G. G. M., & Millar, T. J., 1992, ApJ, 399, L71 [Google Scholar]
- Chuang, K. J., Fedoseev, G., Ioppolo, S., van Dishoeck, E. F., & Linnartz, H., 2016, MNRAS, 455, 1702 [Google Scholar]
- Chuang, K. J., Fedoseev, G., Qasim, D., et al. 2018, ApJ, 853, 102 [NASA ADS] [CrossRef] [Google Scholar]
- Cuppen, H. M., & Herbst, E., 2007, ApJ, 668, 294 [Google Scholar]
- Fedoseev, G., Chuang, K. J., van Dishoeck, E. F., Ioppolo, S., & Linnartz, H., 2016, MNRAS, 460, 4297 [Google Scholar]
- Fuchs, G. W., Cuppen, H. M., Ioppolo, S., et al. 2009, A&A, 505, 629 [NASA ADS] [CrossRef] [EDP Sciences] [Google Scholar]
- Geppert, W. D., Hellberg, F., Österdahl, F., et al. 2005, in Astrochemistry: Recent Successes and Current Challenges, 231, eds. D. C. Lis, G. A. Blake, & E. Herbst, 117 [Google Scholar]
- Geppert, W. D., Hamberg, M., Thomas, R. D., et al. 2006, Faraday Discuss., 133, 177 [Google Scholar]
- Gómez-Ruiz, A. I., Codella, C., Viti, S., et al. 2016, MNRAS, 462, 2203 [Google Scholar]
- Holdship, J., Viti, S., Jiménez-Serra, I., Makrymallis, A., & Priestley, F., 2017, AJ, 154, 38 [NASA ADS] [CrossRef] [Google Scholar]
- Holdship, J., Viti, S., Codella, C., et al. 2019, ApJ, 880, 138 [NASA ADS] [CrossRef] [Google Scholar]
- Huang, K.-Y., & Viti, S., 2023, Faraday Discuss., 245, 181 [Google Scholar]
- Huang, K.-Y., Abbink, D., Viti, S., & García-Burillo, S., 2024, A&A, 688, A130 [NASA ADS] [CrossRef] [EDP Sciences] [Google Scholar]
- James, T. A., Viti, S., Holdship, J., & Jiménez-Serra, I., 2020, A&A, 634, A17 [EDP Sciences] [Google Scholar]
- Jiménez-Serra, I., Caselli, P., Martín-Pintado, J., & Hartquist, T. W., 2008, A&A, 482, 549 [NASA ADS] [CrossRef] [EDP Sciences] [Google Scholar]
- Jiménez-Serra, I., Megías, A., Salaris, J., et al. 2025, A&A, 695, A247 [NASA ADS] [CrossRef] [EDP Sciences] [Google Scholar]
- Li, X., Lu, B., Wang, L., et al. 2022, Nat. Commun., 13, 7150 [Google Scholar]
- Linnartz, H., Ioppolo, S., & Fedoseev, G., 2015, arXiv e-prints [arXiv:1507.02729] [Google Scholar]
- Luca, A., Voulot, D., & Gerlich, D., 2002, WDS’02 Proceedings of Contributed Papers, PART II, 294 [Google Scholar]
- Mathew, T., Esteves, P. M., & Prakash, G. K. S., 2022, Front. Astron. Space Sci., 9, 809928 [Google Scholar]
- McClure, M. K., Rocha, W. R. M., Pontoppidan, K. M., et al. 2023, Nat. Astron., 7, 431 [NASA ADS] [CrossRef] [Google Scholar]
- McElroy, D., Walsh, C., Markwick, A. J., et al. 2013, A&A, 550, A36 [NASA ADS] [CrossRef] [EDP Sciences] [Google Scholar]
- Minissale, M., Dulieu, F., Cazaux, S., & Hocuk, S., 2016, A&A, 585, A24 [NASA ADS] [CrossRef] [EDP Sciences] [Google Scholar]
- Molpeceres, G., Kästner, J., Fedoseev, G., et al. 2021, arXiv e-prints [arXiv:2110.15887] [Google Scholar]
- Qasim, D., Chuang, K. J., Fedoseev, G., et al. 2018, A&A, 612, A83 [NASA ADS] [CrossRef] [EDP Sciences] [Google Scholar]
- Santos, J. C., Chuang, K.-J., Lamberts, T., et al. 2022, ApJ, 931, L33 [NASA ADS] [CrossRef] [Google Scholar]
- Simons, M. A. J., Lamberts, T., & Cuppen, H. M., 2020, A&A, 634, A52 [NASA ADS] [CrossRef] [EDP Sciences] [Google Scholar]
- Sung Lee, H., Drucker, M., & Adams, N. G., 1992, Int. J. Mass Spectrom. Ion Processes, 117, 101 [Google Scholar]
- Turner, B. E., 1998, ApJ, 501, 731 [Google Scholar]
- van Dishoeck, E. F., & Blake, G. A., 1998, ARA&A, 36, 317 [Google Scholar]
- Viti, S., Collings, M. P., Dever, J. W., McCoustra, M. R. S., & Williams, D. A., 2004, MNRAS, 354, 1141 [NASA ADS] [CrossRef] [Google Scholar]
- Wakelam, V., Herbst, E., Loison, J. C., et al. 2012, ApJS, 199, 21 [Google Scholar]
- Williams, D., Hartquist, T., Rawlings, J., Cecchi-Pestellini, C., & Viti, S., 2018, Dynamical Astrochemistry, 1st edn. (London: Royal Society of Chemistry) [Google Scholar]
- Wirström, E. S., Geppert, W. D., Hjalmarson, A., et al. 2011, A&A, 533, A24 [NASA ADS] [CrossRef] [EDP Sciences] [Google Scholar]
- Woods, P. M., Slater, B., Raza, Z., et al. 2013, ApJ, 777, 90 [Google Scholar]
- Yamamoto, S., 2017, Introduction to Astrochemistry: Chemical Evolution from Interstellar Clouds to Star and Planet Formation, 1st edn. (Japan: Springer Tokyo) [Google Scholar]
All Tables
All Figures
|
Fig. 1 Chemical abundances of ice-phase methanol (left panel) and gas-phase methanol (right panel) as a function of time in non-shocked, slow C-shock (10 km/s) and high C-shock (50 km/s) models with a pre-shocked gas density volume of nH2 (init) = 104 cm−3 and ζ= ζ0. The dashed and solid lines correspond to the default and current schemes, respectively. |
| In the text | |
|
Fig. 2 Chemical abundances of surface-phase methanol (left panel) and bulk-phase methanol (right panel) as a function of time in non-shocked, slow C-shock (10 km/s) and high C-shock (50 km/s) models with a pre-shocked gas density volume of nH2 (init) = 104 cm−3 and ζ= ζ0. The dashed and solid lines correspond to the default and current schemes, respectively. |
| In the text | |
|
Fig. 3 Chemical abundances of ice-phase methanol as a function of time in slow C-shock (10−20 km/s) and moderately high C-shock (30 km/s) models with a pre-shocked gas density volume of nH2 (init) = 104 cm−3 and ζ=ζ0. The dashed and solid lines correspond to the default and current schemes, respectively. The evolution of gas temperature, Tk(t), is depicted by the dotted grey lines. |
| In the text | |
|
Fig. 4 Column densities of gaseous CH3OH as a function of time for slow C-shock (10−20 km/s) and high C-shock (50 km/s) models with a pre-shocked gas density volume of nH2 (init) = 105 cm−3 and ζ=ζ0. The dashed and solid lines correspond to the default and current schemes, respectively. The hatches represent the range in the CH3OH column density reported by Holdship et al. (2019) for IRAS2A-R, IRAS2A-B, IRAS4A-R, and IRAS4A-B. |
| In the text | |
|
Fig. 5 Chemical abundances of ice-phase HCO as a function of time in slow C-shock (10−20 km/s) and moderately high C-shock (30 km/s) models with a pre-shocked gas density volume of nH2 (init) = 104 cm−3 and ζ=10 ζ0. The dashed and solid lines correspond to the default and current schemes, respectively. The evolution of gas temperature, Tk(t), is depicted by the dotted grey line. |
| In the text | |
|
Fig. 6 Chemical abundances of ice-phase H2CO as a function of time for slow C-shock models with a pre-shocked gas density volume of nH2 (init) = 106 cm−3 and vshock=10 km/s. The dashed and solid lines correspond to the default and current schemes, respectively. The evolution of gas temperature, Tk(t), is depicted by the dotted grey line. |
| In the text | |
|
Fig. 7 Chemical abundances of gas-phase formaldehyde as a function of time for slow C-shock (left panel) and high C-shock (right panel) models with a pre-shocked gas density volume of nH2 (init) = 105 cm−3. The dashed and solid lines correspond to the default and current schemes, respectively. The evolution of gas temperature, Tk(t), is depicted by the dotted grey line. |
| In the text | |
|
Fig. 8 Column densities of gaseous H2CO as a function of time for slow C-shock (10−20 km/s) and high C-shock (50 km/s) models with a pre-shocked gas density volume of nH2 (init) = 105 cm−3 and ζ=ζ0. The dashed and solid lines correspond to the default and current schemes, respectively. The hatches represent the range in the H2CO column density reported by Gómez-Ruiz et al. (2016) for IRAS4A-R and IRAS4A-B. |
| In the text | |
|
Fig. 9 Chemical abundances of ice-phase CH3O as a function of time for C-shock models with a pre-shocked gas density volume of nH2 (init) = 106 cm−3 and ζ=ζ0. The dashed and solid lines correspond to the default and current schemes, respectively. The evolution of gas temperature, Tk(t), is depicted by the dotted grey lines. |
| In the text | |
Current usage metrics show cumulative count of Article Views (full-text article views including HTML views, PDF and ePub downloads, according to the available data) and Abstracts Views on Vision4Press platform.
Data correspond to usage on the plateform after 2015. The current usage metrics is available 48-96 hours after online publication and is updated daily on week days.
Initial download of the metrics may take a while.