Fig. 10.
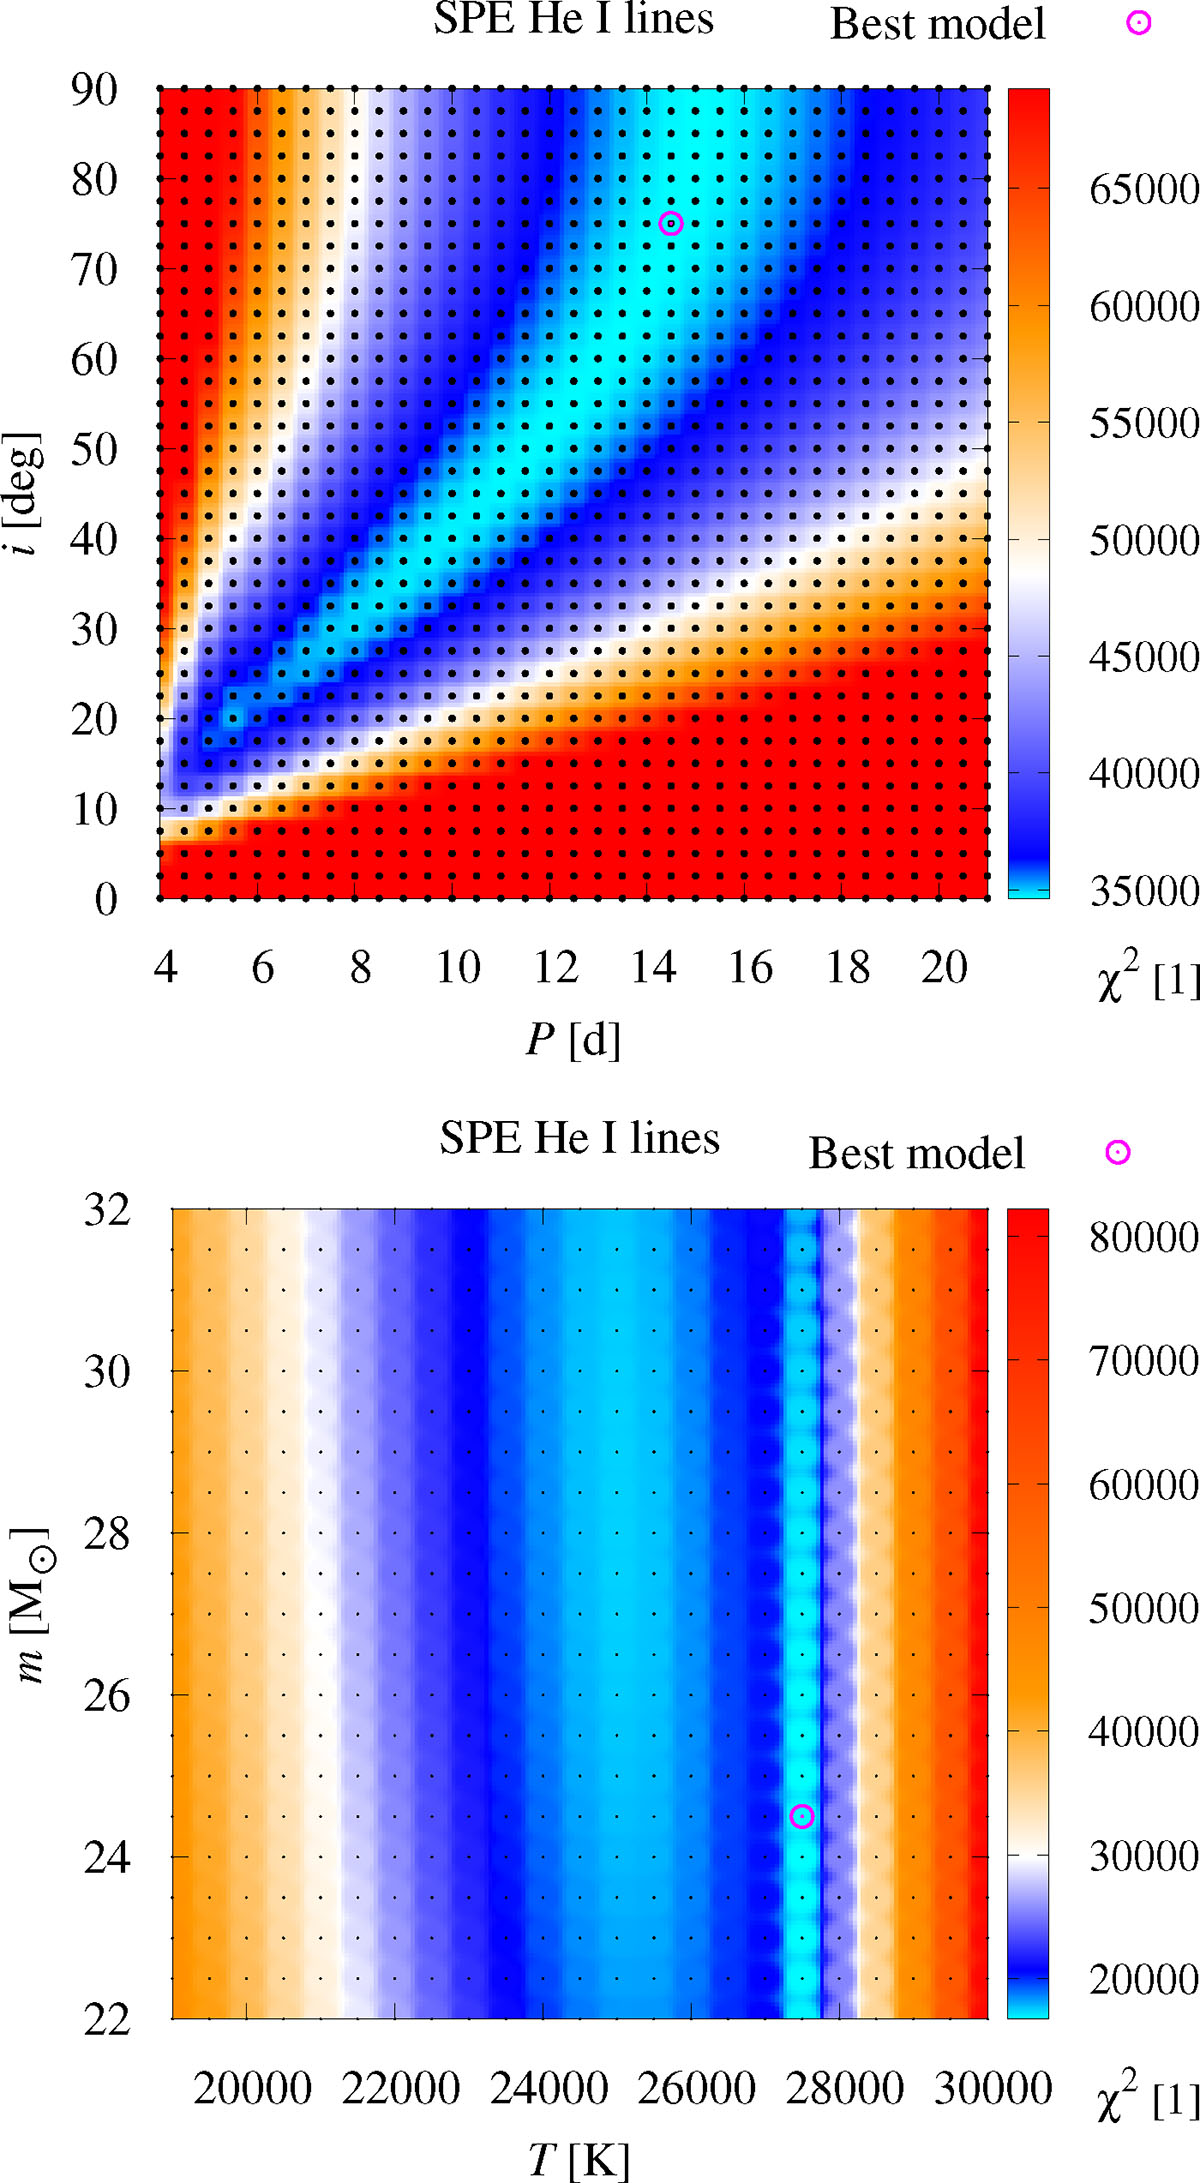
Download original image
Same as Fig. 9, but for the spectroscopic dataset based on He I lines. Top: SED dataset for He I lines exhibits results very similar to spectroscopy based on Balmer lines. The higher Prot and i values are excluded because of other datasets. Bottom: SED dataset for He I lines, indicating two possible solutions at T = 25 000 K or 27 500 K, due to systematic offsets in some lines. The model with T = 25 000 K fits the depths of He I lines better. The map also shows no preference for mass.
Current usage metrics show cumulative count of Article Views (full-text article views including HTML views, PDF and ePub downloads, according to the available data) and Abstracts Views on Vision4Press platform.
Data correspond to usage on the plateform after 2015. The current usage metrics is available 48-96 hours after online publication and is updated daily on week days.
Initial download of the metrics may take a while.