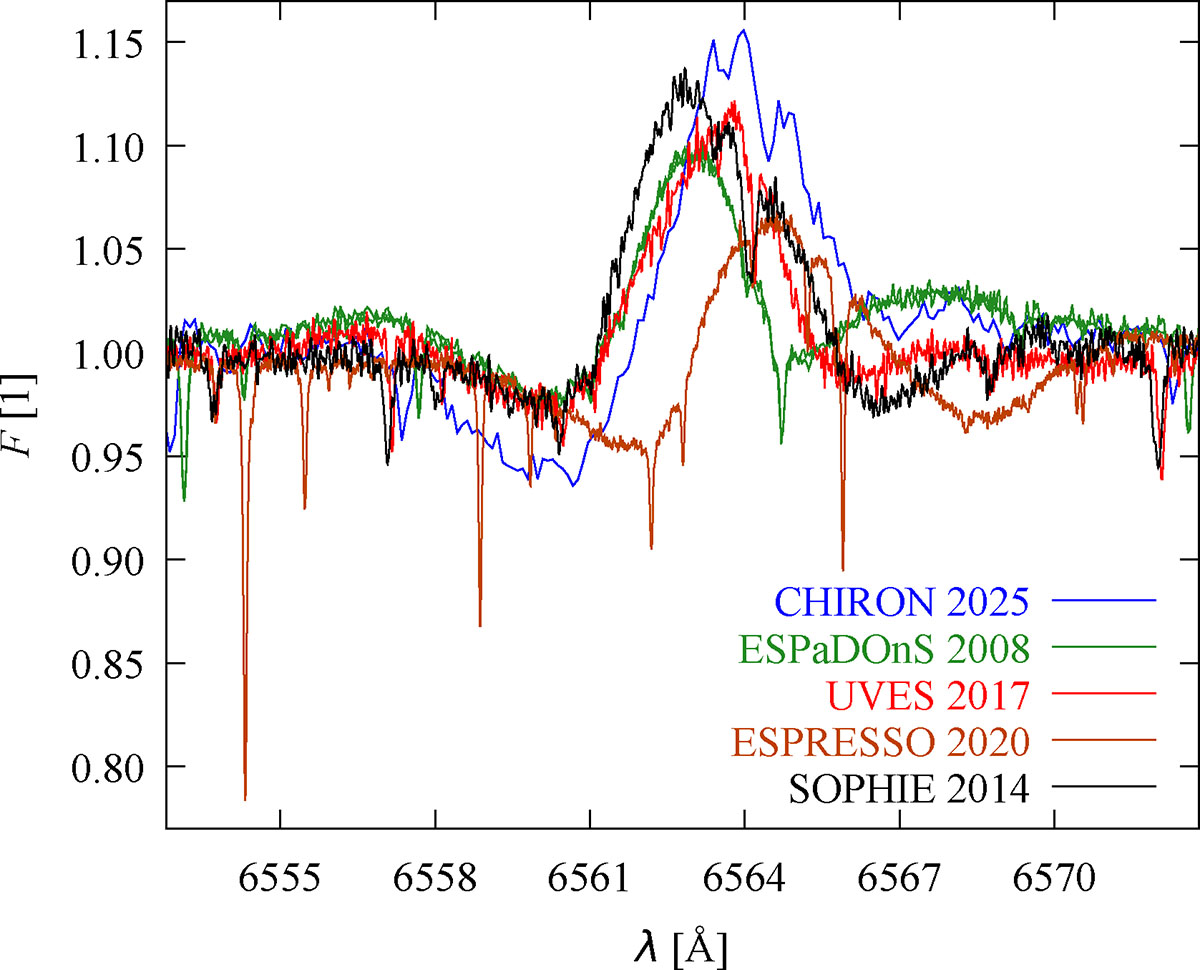
Fig. 11.
Download original image
Spectroscopy of ε Ori showing the Hα line profile that is highly variable and can be in several morphologies, like P Cygni profile, inverse P Cygni profile, double emission, or pure emission (Thompson & Morrison 2013). It implies an intense wind (e.g. Puebla et al. 2016) or a decretion disk fed by mass loss from the star. This variable line was not used in our modelling.
Current usage metrics show cumulative count of Article Views (full-text article views including HTML views, PDF and ePub downloads, according to the available data) and Abstracts Views on Vision4Press platform.
Data correspond to usage on the plateform after 2015. The current usage metrics is available 48-96 hours after online publication and is updated daily on week days.
Initial download of the metrics may take a while.