Fig. C.4.
Download original image
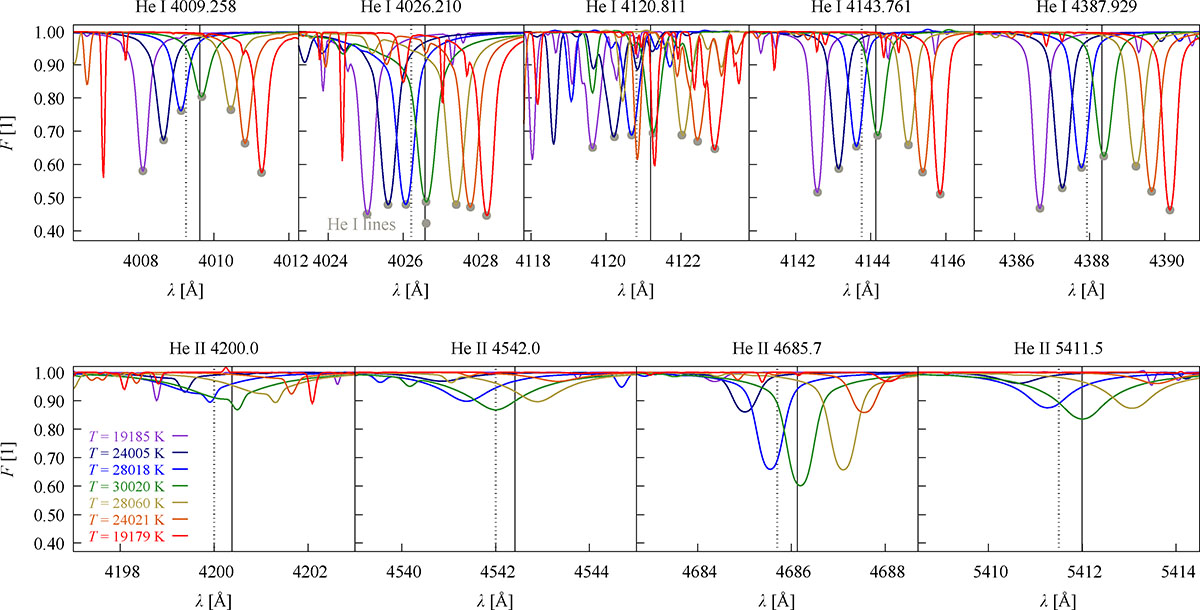
Synthetic He I and He II line profiles from our spectroscopic model, corresponding to selected triangles with given temperatures and RVs. They demonstrate where lines form in our model. For a fast-rotating star, the pole is substantially hotter than the equator. The central line (RV = 0) corresponds to the pole, other lines originate from the equator (RV ≠ 0). He I and He II lines form at different locations on a fast or critically rotating star due to strong temperature gradients. He I lines have the lowest intensity on the poles, while He II lines have the highest intensity at the poles. He I lines are less intense at the pole, while He II lines are less intense on the equator. The grey points indicate the He I lines for clarity.
Current usage metrics show cumulative count of Article Views (full-text article views including HTML views, PDF and ePub downloads, according to the available data) and Abstracts Views on Vision4Press platform.
Data correspond to usage on the plateform after 2015. The current usage metrics is available 48-96 hours after online publication and is updated daily on week days.
Initial download of the metrics may take a while.