Open Access
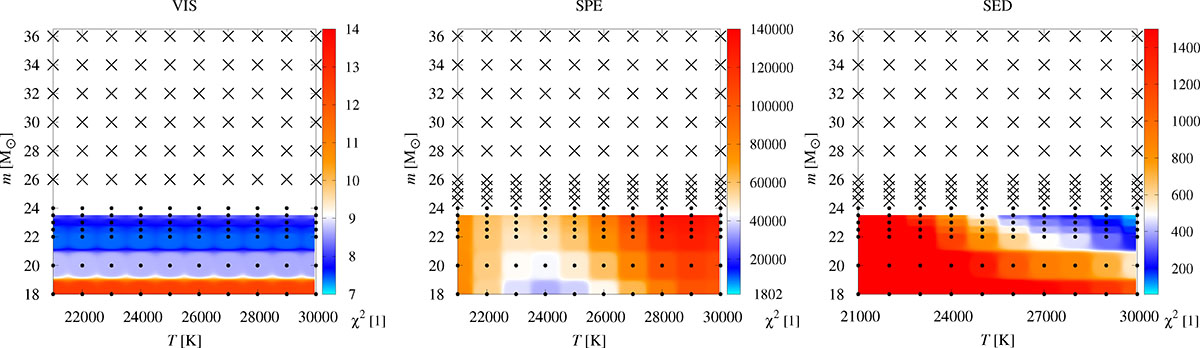
Fig. C.6.
Download original image
Same as the second row of Fig. 9, but for the distance of 350 pc, computed on a somewhat coarser grid. Blank regions mark combinations where R > Rcrit; crosses indicate grid points exceeding this limit. PHOEBE2 model also fails very near the critical boundary, which we explored with finer grids.
Current usage metrics show cumulative count of Article Views (full-text article views including HTML views, PDF and ePub downloads, according to the available data) and Abstracts Views on Vision4Press platform.
Data correspond to usage on the plateform after 2015. The current usage metrics is available 48-96 hours after online publication and is updated daily on week days.
Initial download of the metrics may take a while.