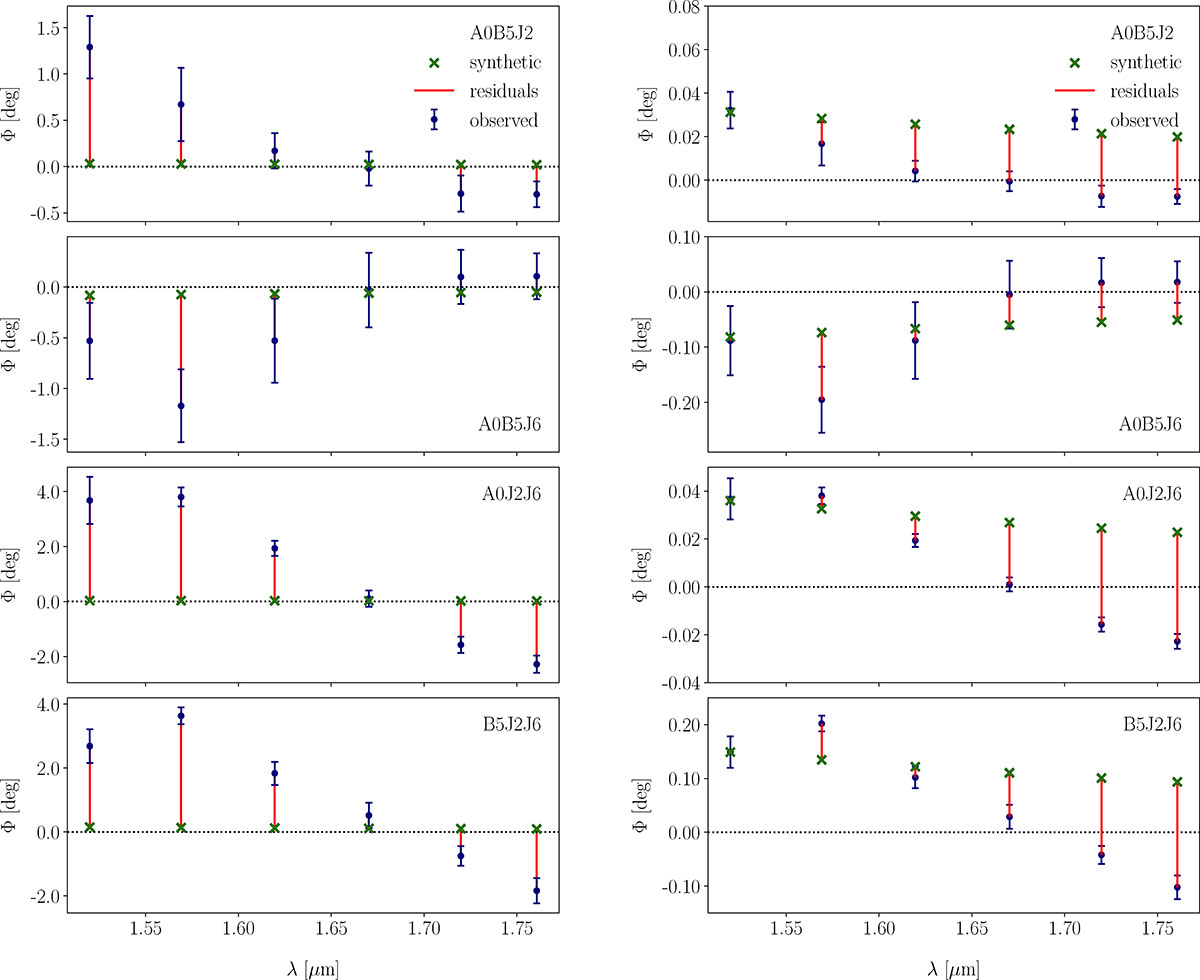
Fig. C.8.
Download original image
Model of ε Ori showing a forward computation of the closure phases with fixed parameters from the visibility model (Fig. 6). The observed closure phases reach up to nearly 4 deg, while the synthetic ones are at most 0.15 deg. If we recalibrate the observed closure phases (left column) by multiplying them by scaling factors 1/40, 1/6, 1/100, and 1/18, respectively for each of the triple baselines (right column), we see similar trends in the observed and synthetic closure phases, arg T3 vs B/λ. We used this asymmetry of the flux to set the orientation of the star’s equator, as seen by the observer, Ω (favouring 300 deg over 120 deg).
Current usage metrics show cumulative count of Article Views (full-text article views including HTML views, PDF and ePub downloads, according to the available data) and Abstracts Views on Vision4Press platform.
Data correspond to usage on the plateform after 2015. The current usage metrics is available 48-96 hours after online publication and is updated daily on week days.
Initial download of the metrics may take a while.