Open Access
Fig. 4.
Download original image
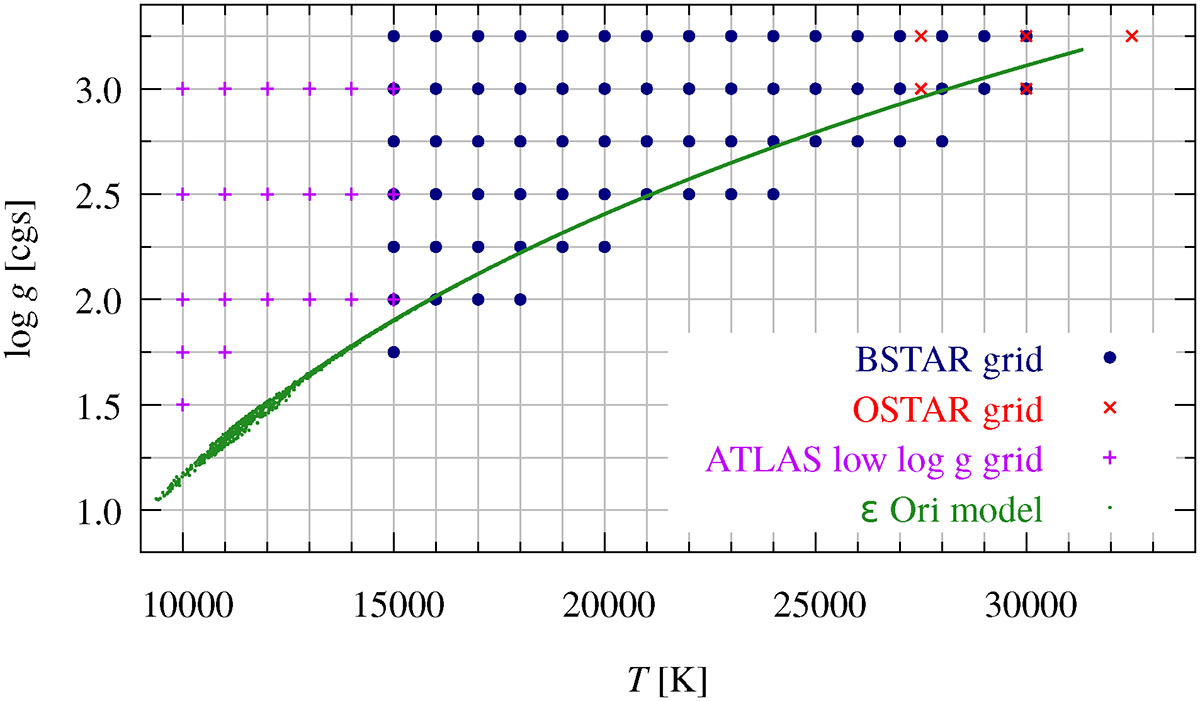
Grids of synthetic spectra BSTAR and OSTAR (Lanz & Hubený 2003, 2007) used in our spectroscopic models. Each spectrum is parametrised by log g and T. To describe also critically rotating stars (cf. green points), it was necessary to compute additional ATLAS spectra (Castelli & Kurucz 2003) for low values of log g and T.
Current usage metrics show cumulative count of Article Views (full-text article views including HTML views, PDF and ePub downloads, according to the available data) and Abstracts Views on Vision4Press platform.
Data correspond to usage on the plateform after 2015. The current usage metrics is available 48-96 hours after online publication and is updated daily on week days.
Initial download of the metrics may take a while.