Fig. 9.
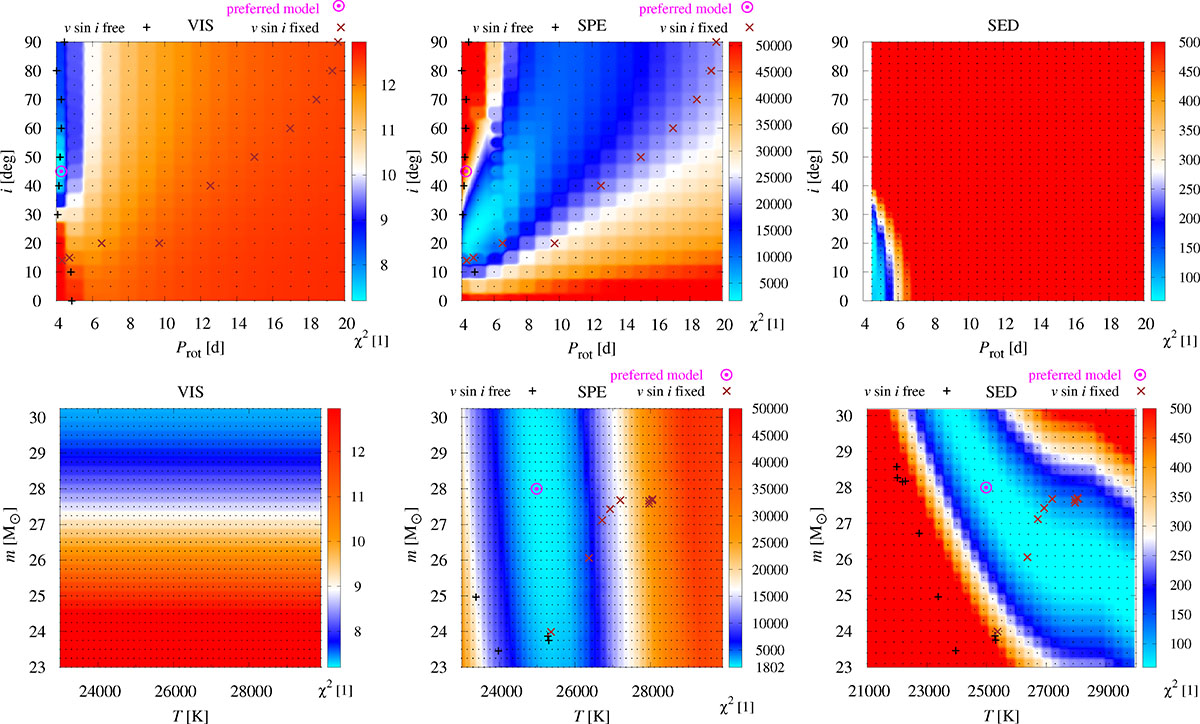
Download original image
Maps of χ2 for the ε Ori model. We performed 2D mapping of χ2 across different datasets: squared visibilities (VIS), spectral lines of Balmer series (SPE), and spectral energy distribution (SED). We systematically varied two parameters to create a regular grid (Prot vs i in the first row, T vs m in the second row). The remaining parameters were held fixed. The colour scale was adjusted as follows: cyan representing the best fit for a given dataset, blue, the acceptable fits, white, the poor fits, orange, the unacceptable fits, and red, the forbidden regions. In the first row, the fixed parameters are those resulting from the best fit of interferometric data in Fig. 6: d, m, and Ω; other fixed parameters are T = 25 000 K, log g = 3.011, and γ = 25.9 km s−1. The dependent parameters were Requiv and v sin i. In the second row, we set Prot and i according to the best fit in the first row. The individual panels, from the upper left, are as follows: I) the VIS dataset shows a preference for a critically rotating star and i around 45 deg; II) the SPE dataset (H lines) shows a preference for a fast-rotating star, Prot = 5 d, i = 25 deg. The correlation between Prot and i is due to rotation and v sin i; III) the SED dataset also allows a critically or fast-rotating star for i close to 20 deg. However, it is possible to re-fit T, R, or d to achieve improved SED fits in other regions of the parameter space; IV) the VIS dataset shows a flat dependence on temperature and the preferred mass; V) the SPE dataset for H lines demonstrates a weak correlation between T and m, the best fit of T is around 25 000 K; and VI) the SED dataset is strongly correlated between T and m due to the Stefan–Boltzmann law and Eq. (7). The crosses indicate the models from Tables 3 and 4.
Current usage metrics show cumulative count of Article Views (full-text article views including HTML views, PDF and ePub downloads, according to the available data) and Abstracts Views on Vision4Press platform.
Data correspond to usage on the plateform after 2015. The current usage metrics is available 48-96 hours after online publication and is updated daily on week days.
Initial download of the metrics may take a while.