Fig. A.1
Download original image
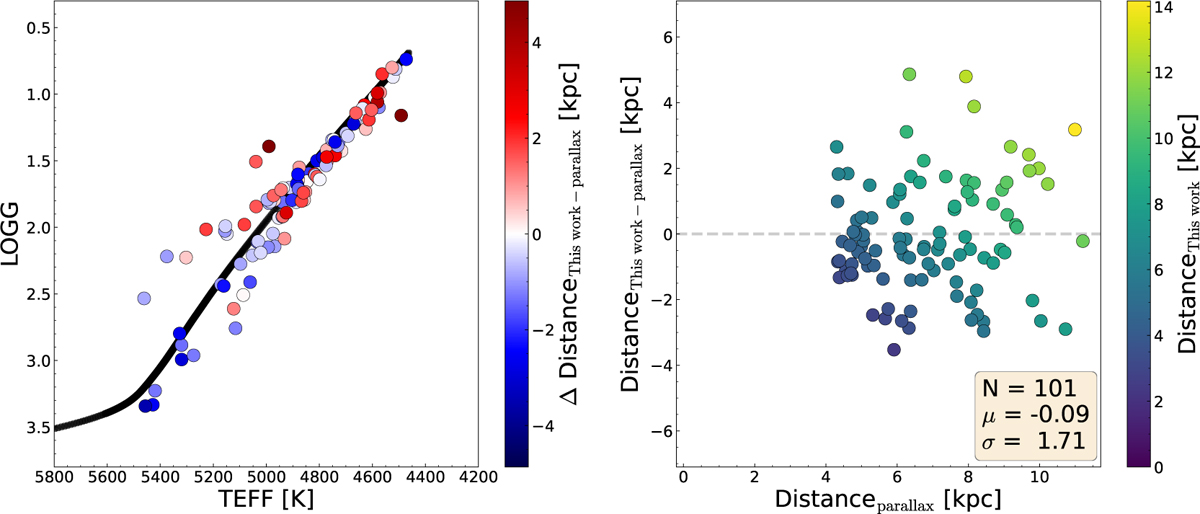
Left panel: Kiel diagram showing a BASTI isochrone corresponding to [M/H] = −2.5 and an age of 10 Gyr in black. Stars from the high confidence sample with to which distances have been determined are shown colour-coded by their offset from the distance determined by parallax. Right panel: Plot of the difference between our distances and the parallax distances plotted against parallax distance for the same stars as the left panel.
Current usage metrics show cumulative count of Article Views (full-text article views including HTML views, PDF and ePub downloads, according to the available data) and Abstracts Views on Vision4Press platform.
Data correspond to usage on the plateform after 2015. The current usage metrics is available 48-96 hours after online publication and is updated daily on week days.
Initial download of the metrics may take a while.