Fig. 4
Download original image
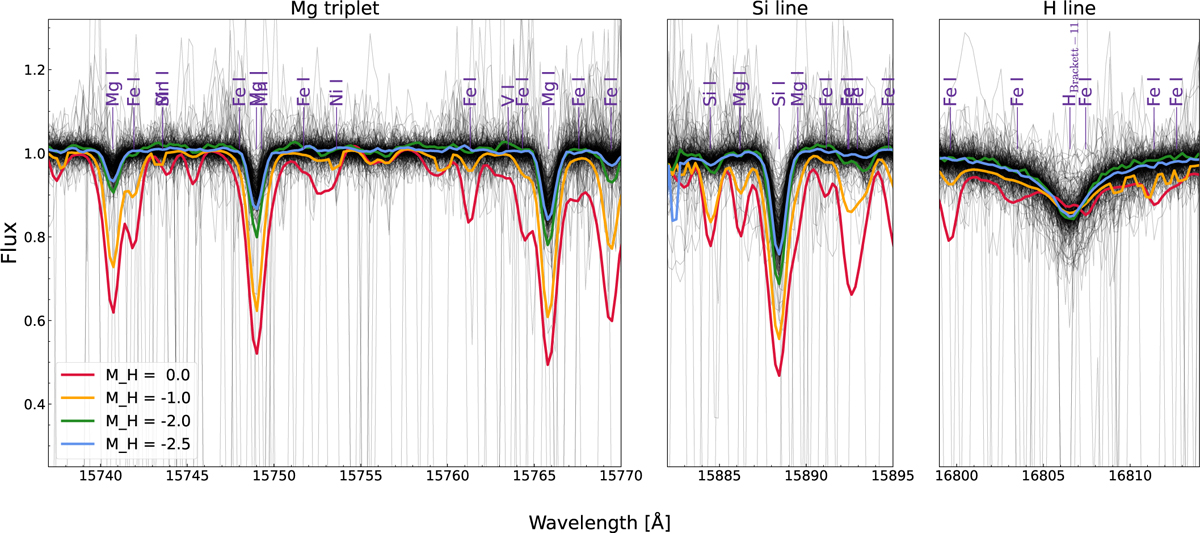
Spectral view of APOGEE spectra for the 326 candidate VMP stars in this work (grey lines), after cleaning the sample. Vertical thin lines across the wavelength space connect to artefacts in some of these spectra that are not affecting the overall analysis. Also shown are the averaged APOGEE spectra for red giants with temperatures and gravities in a range comparable to that of the bulk of our sample (4100 K < Teff < 5200 K and 0.5 < log(g) < 3.5) and a distinct range in metallicities. The comparison clearly shows that our selected sample stars are indeed very metal poor.
Current usage metrics show cumulative count of Article Views (full-text article views including HTML views, PDF and ePub downloads, according to the available data) and Abstracts Views on Vision4Press platform.
Data correspond to usage on the plateform after 2015. The current usage metrics is available 48-96 hours after online publication and is updated daily on week days.
Initial download of the metrics may take a while.