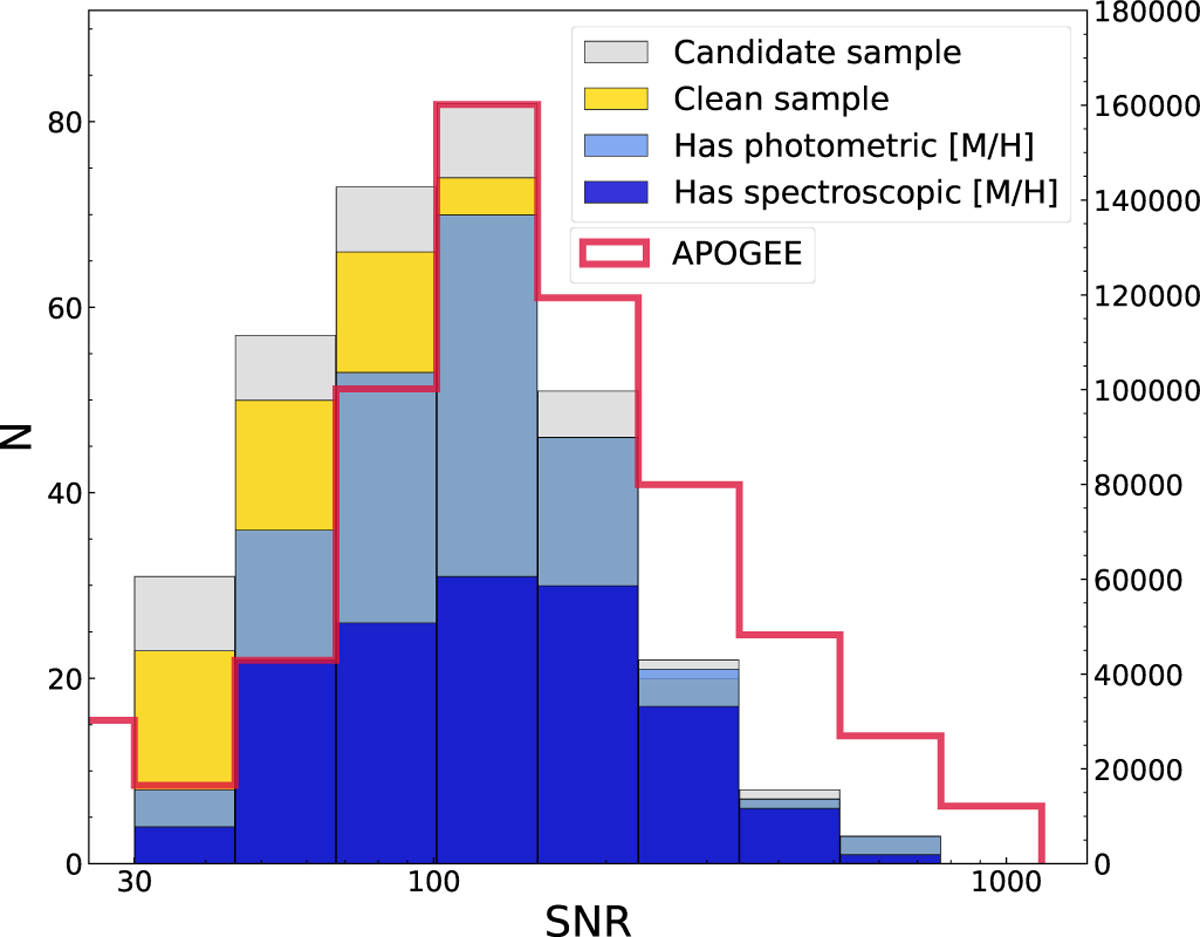
Fig. 5
Download original image
Normalised histogram of the S/N on a log scale of the candidate stars, shown in grey, and of the subset of candidates with values from the literature sources in Sect. 3, including the additional sources in section 3.6, split into photometric and spectroscopic metallicities. The overall S/N distribution of APOGEE is shown as a red outline, with the right side y-axis tracking their numbers.
Current usage metrics show cumulative count of Article Views (full-text article views including HTML views, PDF and ePub downloads, according to the available data) and Abstracts Views on Vision4Press platform.
Data correspond to usage on the plateform after 2015. The current usage metrics is available 48-96 hours after online publication and is updated daily on week days.
Initial download of the metrics may take a while.