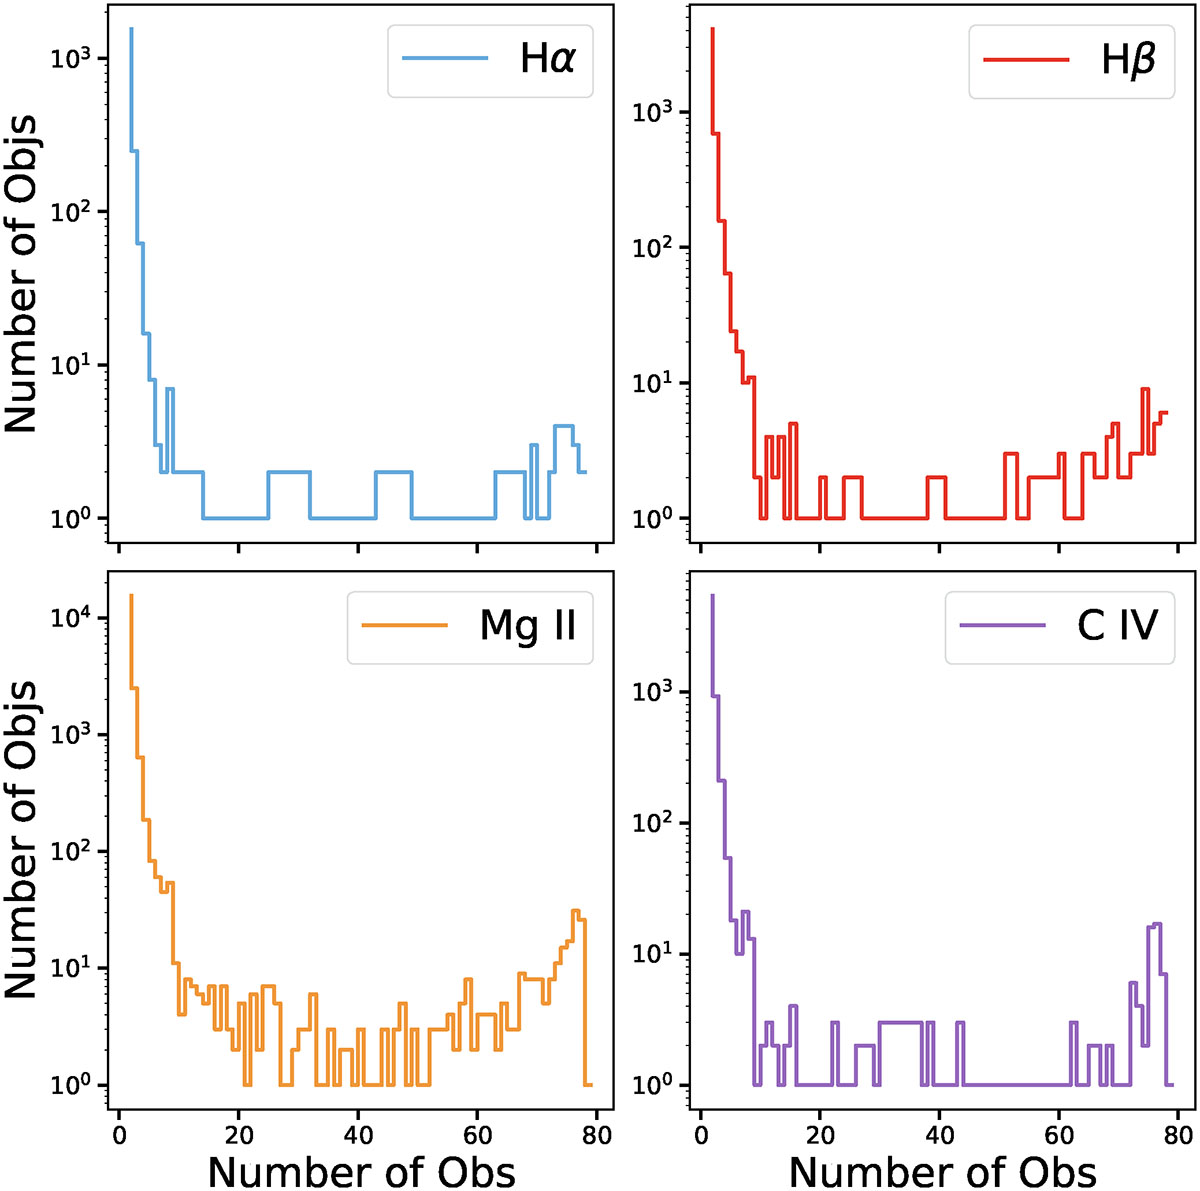
Fig. 1.
Download original image
Distribution of sources in our samples by the number of repeated spectroscopic observations. The x-axis shows the number of observations per source, while the y-axis indicates the number of sources with that observation count. Only sources with more than one spectroscopic observation are shown, as those with a single observation are not included in our analysis.
Current usage metrics show cumulative count of Article Views (full-text article views including HTML views, PDF and ePub downloads, according to the available data) and Abstracts Views on Vision4Press platform.
Data correspond to usage on the plateform after 2015. The current usage metrics is available 48-96 hours after online publication and is updated daily on week days.
Initial download of the metrics may take a while.