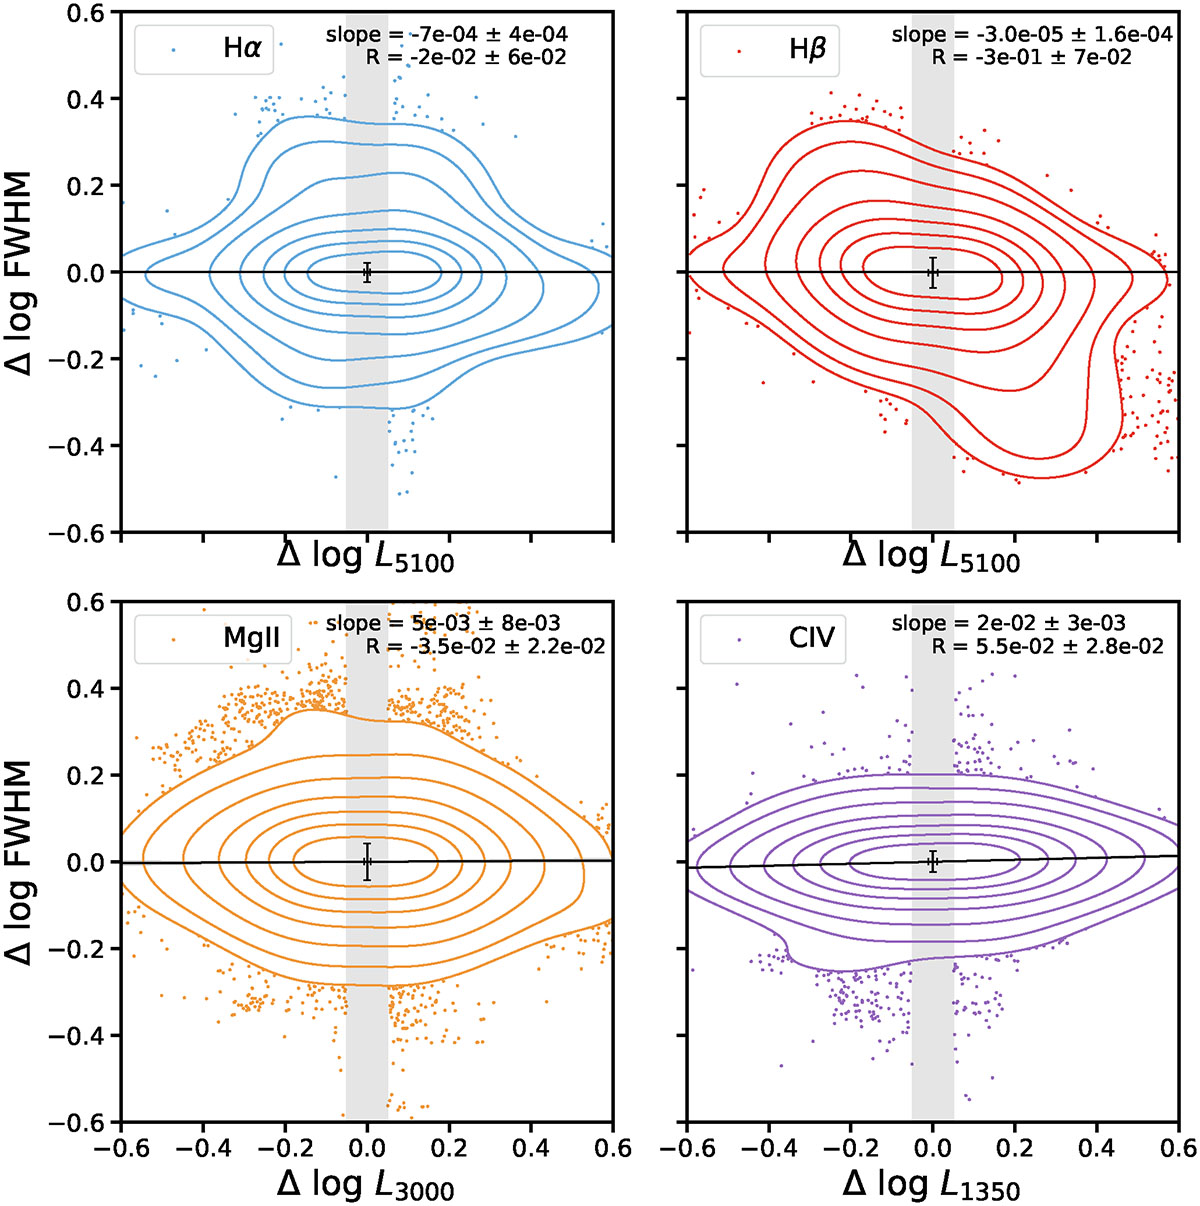
Fig. 2.
Download original image
Variation in emission line FWHM as a function of the change in continuum luminosity, for Hα, Hβ, Mg II, and C IV, respectively. No significant breathing effect is detected in Hα, Hβ, or Mg II, with regression slopes consistent with zero. A weak but statistically significant anti-breathing is observed in C IV. In each panel, the solid black line denotes the best-fit regression slope (with the best-fit slope and correlation coefficient R provided), and the error bar at the center represents the median statistical uncertainty of the data points. Interestingly, the Hβ panel shows a clear excess of data points in the upper-left and lower-right regions, suggesting that strong breathing is present in a small subset of pairs, even though the sample as a whole shows no average breathing signal.
Current usage metrics show cumulative count of Article Views (full-text article views including HTML views, PDF and ePub downloads, according to the available data) and Abstracts Views on Vision4Press platform.
Data correspond to usage on the plateform after 2015. The current usage metrics is available 48-96 hours after online publication and is updated daily on week days.
Initial download of the metrics may take a while.