Open Access
Fig. 3.
Download original image
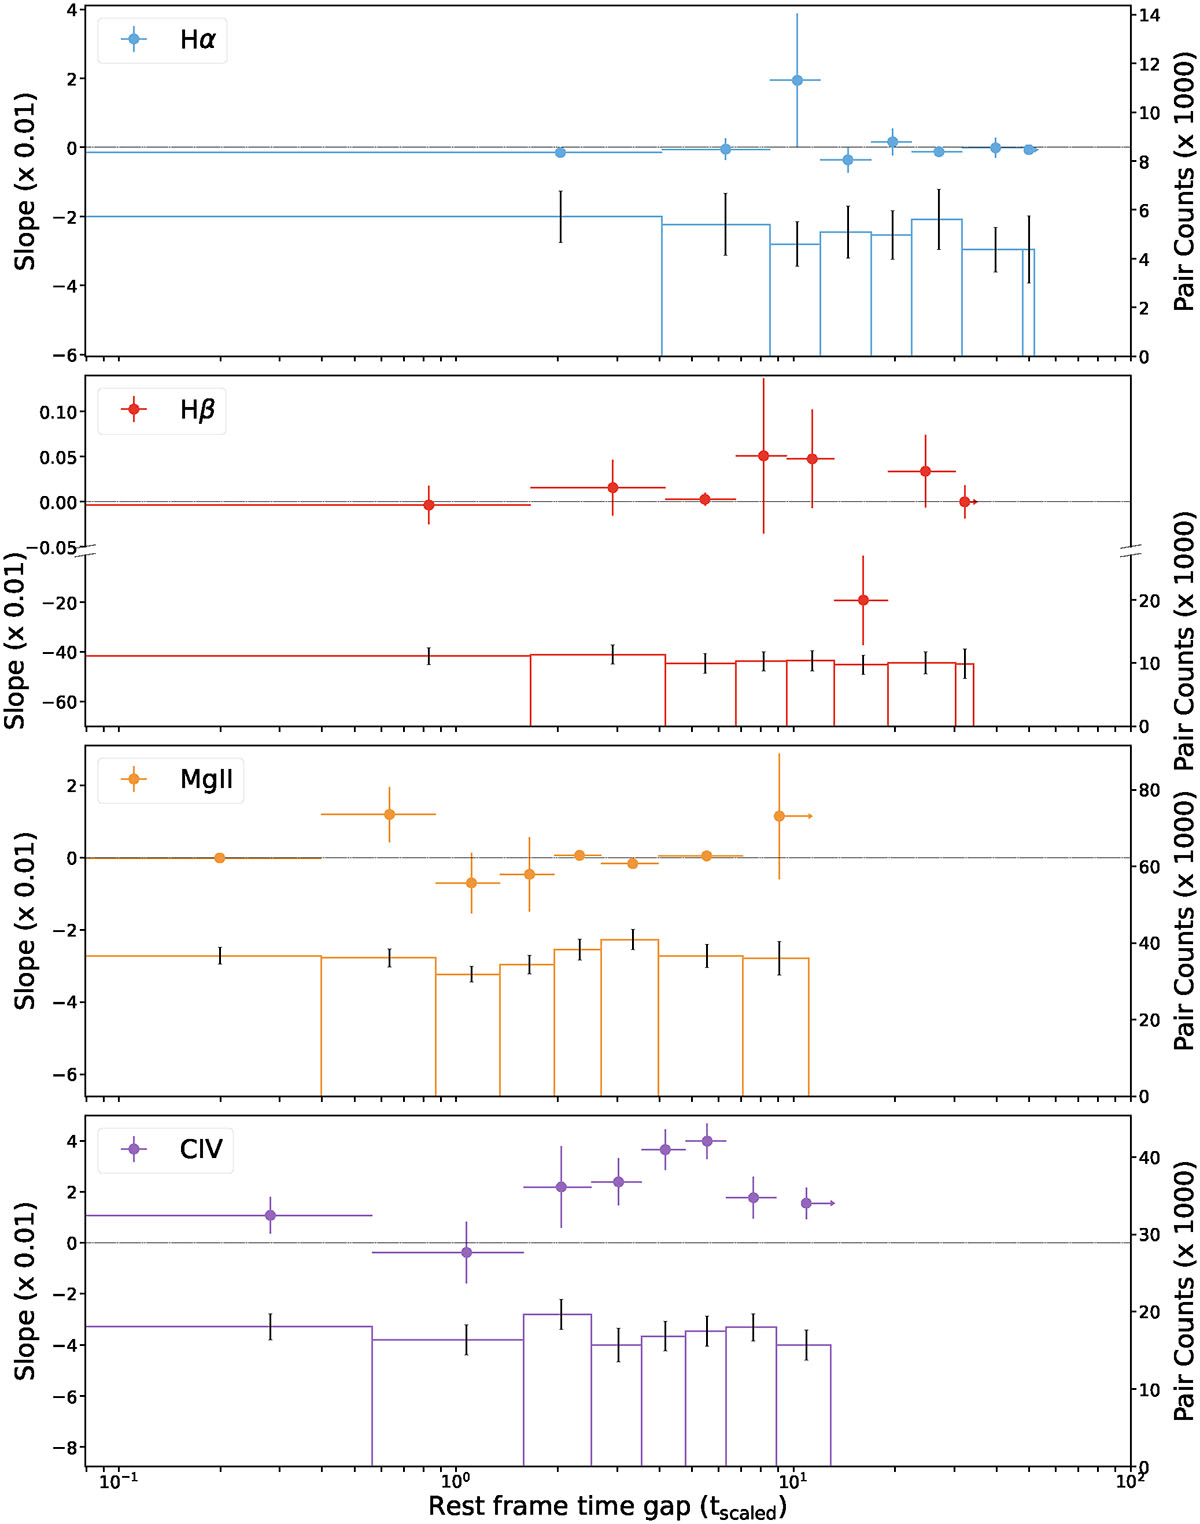
Breathing effect slope as a function of the rest-frame time interval between observations for all four broad emission lines. The bar plot shows the number of observation pairs in each bin, with black error bars indicating the scatter in the pair counts, estimated via bootstrapping.
Current usage metrics show cumulative count of Article Views (full-text article views including HTML views, PDF and ePub downloads, according to the available data) and Abstracts Views on Vision4Press platform.
Data correspond to usage on the plateform after 2015. The current usage metrics is available 48-96 hours after online publication and is updated daily on week days.
Initial download of the metrics may take a while.