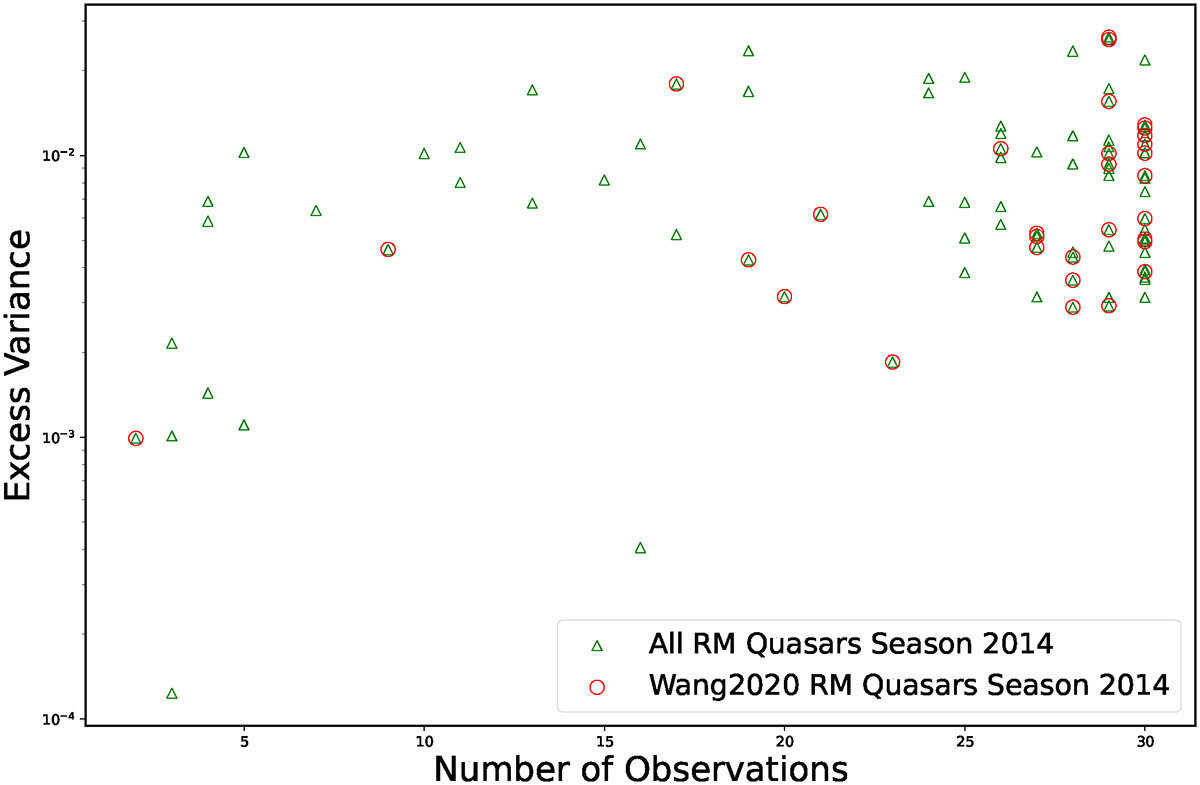
Fig. 5.
Download original image
Excess variance as a function of number of spectroscopic observations per SDSS-RM quasar. Red circles represent RM quasars with significant Hβ lag detections from Wang et al. (2020), while green triangles represent all RM quasars in our parent sample, including those without detectable lags. Both samples are based on data from the 2014 monitoring season. There is no clear distinction in either the number of observations or the excess variance between quasars with detected lags and those without.
Current usage metrics show cumulative count of Article Views (full-text article views including HTML views, PDF and ePub downloads, according to the available data) and Abstracts Views on Vision4Press platform.
Data correspond to usage on the plateform after 2015. The current usage metrics is available 48-96 hours after online publication and is updated daily on week days.
Initial download of the metrics may take a while.