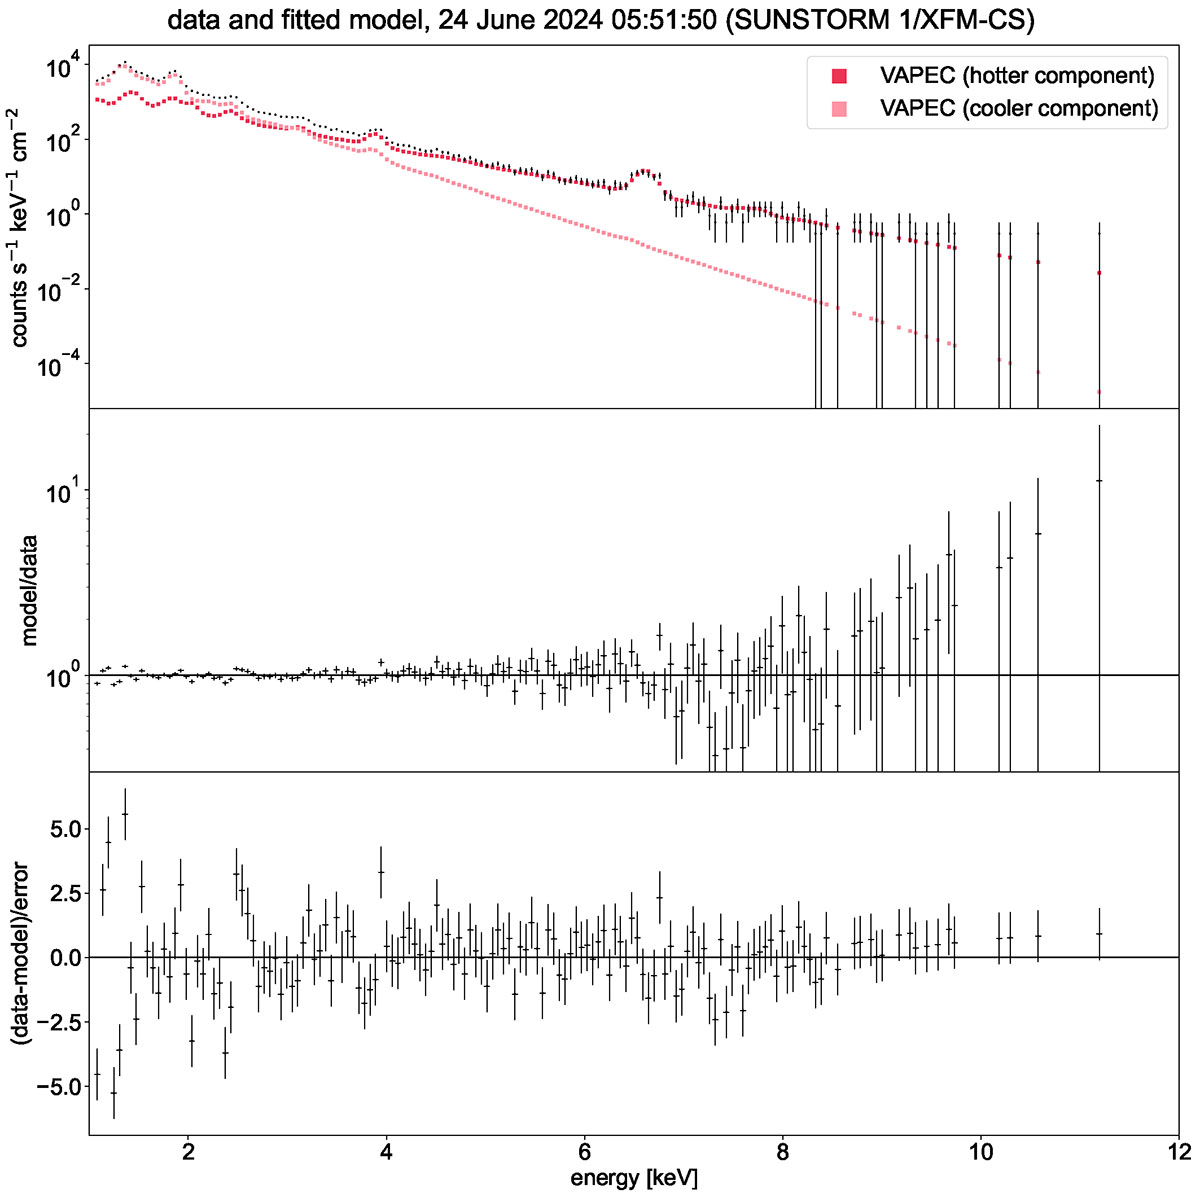
Fig. 1.
Download original image
Example solar X-ray spectrum of the early decay phase of the flare event at 05:51:50 UTC, observed by SUNSTORM 1/XFM-CS and fit for 1–12 keV using a two-component VAPEC model. Top panel: Data and folded model shown with hotter (dark red) and cooler (light red) model components. Middle panel: Data divided by the folded model. Bottom panel: Normalized fit residuals.
Current usage metrics show cumulative count of Article Views (full-text article views including HTML views, PDF and ePub downloads, according to the available data) and Abstracts Views on Vision4Press platform.
Data correspond to usage on the plateform after 2015. The current usage metrics is available 48-96 hours after online publication and is updated daily on week days.
Initial download of the metrics may take a while.