Fig. 1
Download original image
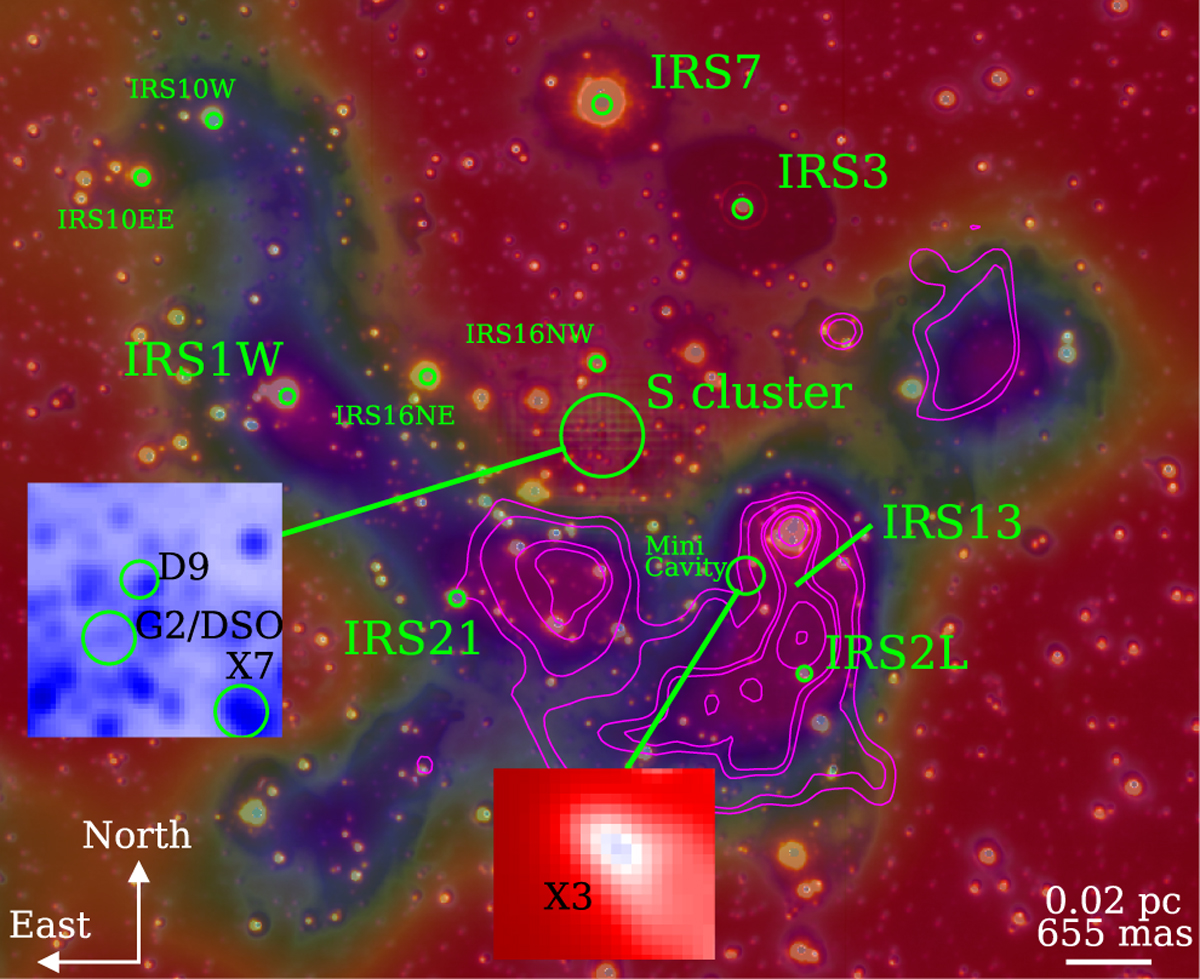
Multiwavelength finding chart of the inner ≈0.8 pc of the Galactic center. For this representation of the fraction of the inner parsec, we used ALMA continuum data observed at (9.99 ± 1.58)×1010 Hz, which are represented as green in the plot. The red background image and blue emission was observed with NACO in the K- and L-band, respectively. We overlay the plot with the Doppler-shifted Brγ emission line observed at 2.1648 μm using ERIS (magenta) and a related width of ±330 km/s. The contour lines represent 9%, 13%, 26%, 30%, 43%, and 65% of the peak emission of IRS 13 of about 0.9 × 10⁻⁶W/cm2 (Maillard et al. 2004).
Current usage metrics show cumulative count of Article Views (full-text article views including HTML views, PDF and ePub downloads, according to the available data) and Abstracts Views on Vision4Press platform.
Data correspond to usage on the plateform after 2015. The current usage metrics is available 48-96 hours after online publication and is updated daily on week days.
Initial download of the metrics may take a while.