| Issue |
A&A
Volume 704, December 2025
|
|
|---|---|---|
| Article Number | A7 | |
| Number of page(s) | 16 | |
| Section | Galactic structure, stellar clusters and populations | |
| DOI | https://doi.org/10.1051/0004-6361/202556229 | |
| Published online | 28 November 2025 | |
Closing the gap: Follow-up observations of peculiar dusty objects close to Sgr A* using ERIS
1
I.Physikalisches Institut der Universität zu Köln,
Zülpicher Str. 77,
50937
Köln,
Germany
2
Department of Theoretical Physics and Astrophysics, Faculty of Science, Masaryk University,
Kotlářská 2,
611 37
Brno,
Czech Republic
3
Astronomical Institute, Czech Academy of Sciences,
Boční II 1401,
14100
Prague,
Czech Republic
4
Indiana University, Department of Astronomy,
Swain Hall West, 727 E 3 rd Street,
Bloomington,
IN
47405,
USA
5
Charles University, Faculty of Mathematics and Physics, Astronomical Institute,
V Holešovičkách 2,
18000
Prague,
Czech Republic
6
Max-Planck-Institut für Radioastronomie,
Auf dem Hügel 69,
53121
Bonn,
Germany
★ Corresponding author: This email address is being protected from spambots. You need JavaScript enabled to view it.
Received:
3
July
2025
Accepted:
1
October
2025
Abstract
Context. In addition to the supermassive black hole Sgr A*, the inner parsec of our Galactic center is home to numerous habitats that have yielded a cornucopia of scientific results. One of these environments is the S cluster, which consists of two distinct populations: the main-sequence S stars, and the dusty G objects. While the majority of the brightest S stars can be classified as young B stars, the G sources can be described as dusty objects whose nature is still under debate.
Aims. We focus on the most prominent G objects in the S cluster and follow their Keplerian trajectory around Sgr A*. With this, we test the predictions based on almost two decades of monitoring of the direct vicinity of our central supermassive black hole using NACO and SINFONI, formerly mounted at the Very Large Telescope (VLT). The goal is to increase the existing data baseline for G2/DSO, D9, and X7 to obtain insights into their evolution on their Keplerian trajectories. In addition, we revisit the massive young stellar object (YSO) X3 and determine the potential impact of its environment on this highly dynamic source.
Methods. The successor to the two instruments is called ERIS and offers upgraded optics and improved properties, including an enhanced spectral resolution. We used the IFU mode of ERIS, called SPIFFIER. We searched for the Doppler-shifted Brγ emission line to rediscover peculiar objects in the S cluster using SPIFFIER with the highest available spatial plate scale of 12.5 mas. Furthermore, we derived the Brγ luminosity of G2/DSO to inspect the degree of its change more than ten years after the pericenter passage. If present, a decrease in the Brγ luminosity of G2/DSO in the descending part of the orbit would directly affect the direction of the debate about its nature.
Results. All the sources we inspected were rediscovered in their predicted astrometric positions. This underlines the robustness of our monitoring efforts of the Galactic center. Furthermore, we found no signatures of a Brγ luminosity variability for G2/DSO. The enhanced capabilities offered by ERIS allowed us to recover the periodic pattern that resulted in the detection of D9, the first binary system in the S cluster. The bow-shock source X7 does not deviate from its proposed Keplerian orbit and follows its projected orbit toward the north. Finally, we verified prominent stellar outflows for the massive YSO X3.
Key words: binaries: spectroscopic / stars: black holes / stars: kinematics and dynamics / Galaxy: center / infrared: stars
© The Authors 2025
 Open Access article, published by EDP Sciences, under the terms of the Creative Commons Attribution License (https://creativecommons.org/licenses/by/4.0), which permits unrestricted use, distribution, and reproduction in any medium, provided the original work is properly cited.
This article is published in open access under the Subscribe to Open model. This email address is being protected from spambots. You need JavaScript enabled to view it. to support open access publication.
1 Introduction
One significant advantage of the scientific habitat that envelopes the supermassive black hole (SMBH) Sagittarius A* (Sgr A*) (see Eckart et al. 2017; Genzel 2022; Ciurlo & Morris 2026, for recent reviews) is the extensive data baseline that enables a detailed survey of individual sources. Based on the ongoing monitoring efforts of the Galactic center and, in particular, on the direct vicinity of Sgr A* using system for high angular resolution pictures (SHARP), the first Keplerian orbit of S2 was presented by Schödel et al. (2002). By including nasmyth adaptive optics system - near-infrared imager and spectrograph (NACO) K-band data, a first glimpse of the stellar content and the related Keplerian approximation of the S-cluster members was obtained by Gillessen et al. (2009). Follow-up studies of the S stars that orbit Sgr A* showed an increased stellar density and increased the number of detected cluster members by a factor of two (Ali et al. 2020). On even larger scales between 40 mpc and 1 pc, von Fellenberg et al. (2022) and Jia et al. (2023) showed different distinct stellar substructures following the disk detections by Paumard et al. (2006) and Lu et al. (2009). The nuclear stellar cluster today appears to partially consist of disk-like structures (Bartko et al. 2009; Ali et al. 2020; Peißker et al. 2024c,b) that interact with each other dynamically (Šubr et al. 2009; Singhal et al. 2024). This interaction can be visualized by distinctive orbital parameters, such as the inclination, the longitude of the ascending node, and the semimajor axis. The broad range of possible orbital configurations was analyzed in detail by Šubr et al. (2009) and Haas et al. (2011), who included the gravitational interaction with the circumnuclear disk that acts as a perturber on distances of a few parsecs with respect to Sgr A*.
On smaller scales, Suková et al. (2021) suggested that stellar transits might trigger quasiperiodic accretion events onto Sgr A* as well as an intermittent increased outflow, which provides an interesting (but speculative) explanation for the observation of one of the brightest infrared flares of the supermassive black hole by Do et al. (2019b). In general, many attempts have been made to explain the radiative processes of Sgr A* using a broad coverage of the electromagnetic spectrum (Yusef-Zadeh et al. 2006; Eckart et al. 2008, 2012). Although the rapid variability of Sgr A* was targeted mainly with a multiwavelength approach using different instruments and wavelengths (Witzel et al. 2018, 2021), the superior sensitivity of the James Webb Space Telescope allowed for a direct observation of constant flickering of the supermassive black hole (Yusef-Zadeh et al. 2025).
These efforts are only possible through the mentioned monitoring of the Galactic center. The heart of our Galaxy not only hosts a supermassive black hole and interesting stellar distributions, but is also home to a peculiar class of objects. A population of faint dusty objects that can be found at different distances from Sgr A* (Gillessen et al. 2012; Eckart et al. 2013; Peißker et al. 2020a). Zajaček et al. (2014) already suggested that these objects might be former binary systems that have migrated into the inner parsec and subsequently split up as a result of the Hills mechanism. Stephan et al. (2016) followed up on this idea and proposed that the population of faint objects might be related to mergers driven by the von-Zeipel-Lidov-Kozai (vZLK) effect (von Zeipel 1910; Lidov 1962; Kozai 1962; Lithwick & Naoz 2011). Regardless of the formation scenario (binary merger products or pre-main-sequence stars), the broadband spectrum of the dusty objects is consistent with a rather compact (a few astronomical units) optically thick envelope (partially inflowing or outflowing) that is additionally asymmetric due to the bow-shock formation (Zajaček et al. 2017), which can address the reported near-infrared polarized emission (Shahzamanian et al. 2016) (for a recent review of the characteristics and formation scenarios of dusty (G) objects, see Zajaček et al. (2024).
Recently, Peißker et al. (2024a) found evidence that the G-population (Eckart et al. 2013; Peißker et al. 2020a) may indeed host pre- and post-mergers, as proposed by Ciurlo et al. (2020). The detection of the first binary system in the S cluster called D9 was possible because of the intense observation campaigns using spectrograph for integral field observations in the near infrared (SINFONI). Hence, the progress in understanding fundamental processes close to our supermassive black hole is only possible with an extensive data baseline that covers multiple wavelengths. These efforts also resulted in the observation of a putative accretion event of a thermal clump on the massive young stellar object (YSO) system X3 (Clénet et al. 2003; Mužić et al. 2010; Peißker et al. 2023b). The formation scenario of X3 is under debate and might be related to migration effects (Bonnell & Rice 2008; Hobbs & Nayakshin 2009; Jalali et al. 2014; Peißker et al. 2024b).
We provide an update on the continued monitoring of dusty sources in the S cluster and focus on the most prominent objects, G2/DSO (Peißker et al. 2021b) and D9 (Peißker et al. 2024a), using the successor of the very large telescope (VLT) instruments NACO and SINFONI, enhanced resolution imager and spectrograph (ERIS). Using the recently obtained ERIS data, we can close the gap in the data baseline between 2019 and 2024 to study peculiar objects in the S cluster. In Section 2, we list the data we used. In Section 3 we present the results of this observational campaign. Finally, the results are discussed in Section 4, which is followed by a comprehensive conclusion in Section 5.
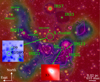 |
Fig. 1 Multiwavelength finding chart of the inner ≈0.8 pc of the Galactic center. For this representation of the fraction of the inner parsec, we used ALMA continuum data observed at (9.99 ± 1.58)×1010 Hz, which are represented as green in the plot. The red background image and blue emission was observed with NACO in the K- and L-band, respectively. We overlay the plot with the Doppler-shifted Brγ emission line observed at 2.1648 μm using ERIS (magenta) and a related width of ±330 km/s. The contour lines represent 9%, 13%, 26%, 30%, 43%, and 65% of the peak emission of IRS 13 of about 0.9 × 10⁻⁶W/cm2 (Maillard et al. 2004). |
2 Data
This section lists the data that we used and downloaded from the ESO archive1. To provide an overview of the sources mentioned in Sect. 1, we present a finding chart in Fig. 1. The data related to the finding chart are also listed in Appendix A. In contrast to previous studies (Peißker et al. 2019, 2020a, 2021b), we did not apply the Lucy-Richardson algorithm to the data.
2.1 ERIS
In 2022, first light was announced for the ERIS mounted at the VLT. The system provides an imaging and integral field unit (IFU) mode, which are called Near-Infrared Camera System (NIX) and Spectrometer for Infrared Faint Field Imaging Enhanced Resolution (SPIFFIER). ERIS-SPIFFIER is a direct upgrade to the Spectrograph for Integral Field Observations in the Near Infrared (SINFONI) and was used for the data analysis in this work. Both systems, ERIS-NIX and ERIS-SPIFFIER, are fed with an adaptive optics system that allows the use of a natural guide star (NGS) and a laser guide star (LGS). In Table 1 we list all the data we used for the analysis. Since the standard deviation of the continuum is affected by strong absorption and emission lines in the spectrum, we used the continuum level to measure the quality of the Brγ emission line. Hence, the S/N indicated in Table 1 can be considered as a lower level. In general, the data quality is superior to that of the SINFONI observations with a comparable integration time (Peißker et al. 2021b; Davies et al. 2023) (for further information about ERIS, we refer to Kuntschner et al. (2014); Marchetti et al. (2014); Pearson et al. (2016) and Davies et al. (2018, 2023)).
List of ERIS data.
2.2 Additional data
For Fig. 1, we used Atacama large millimeter/submillimeter array (ALMA) and NACO data in addition to the ERIS observations presented in the former section. All the results we present are continued monitoring efforts of the S cluster and a source in the mini-cavity close to IRS 13 that lasted for about two decades using mainly SINFONI and NACO (Peißker et al. 2023c, 2024b) (we refer to Peißker et al. (2021a), Peißker et al. (2021b, 2023a), and Peißker et al. (2023b) for a detailed analysis of the sources).
2.3 Data reduction
The data reduction of the ERIS data used standard correction processes such as FLAT fielding, DISTORTION correction, and WAVELENGTH calibration. We used GASGANO and ESOREFLEX to reduce the data (ESO 2012; Freudling et al. 2013). The data we show are the stacked results of individual observations to increase the S/N level (Table 1). Remaining hot pixels were removed individually. Except for Fig. 1, all images were homogenized with a 2-pixel Gaussian to increase the structures of the shown sources.
2.4 Source selection
We focus on the kinematic and astrometric analysis of peculiar sources. The ongoing analysis of these sources directly addresses their proposed nature.
2.4.1 G2/DSO
As proposed in the literature, some authors are in favor of describing the source G2/DSO as a coreless gas cloud that orbits the SMBH in the S cluster (Gillessen et al. 2012). Although the scenario of a gas cloud that might partially be accreted by Sgr A* is not supported by observations (Witzel et al. 2014; Valencia-S. et al. 2015; Tsuboi et al. 2013, 2015) and the comparisons of the data with the proposed models (Shahzamanian et al. 2016, 2017; Zajaček et al. 2017; Peißker et al. 2021b), we verified the stability of G2/DSO in this post-pericenter phase.
2.4.2 D9
In Peißker et al. (2024a), we presented the first detection of a binary inside the S cluster (Fig. 1). The binary system belongs to the G-object population and orbits Sgr A* on a mildly eccentric trajectory. Given the vZLK timescales, it is possible that the binary will eventually merge (Haas & Šubr 2016, 2021). Following its orbit will reduce the uncertainties regarding the stellar parameters and might reveal expected fluctuations of its brightness.
2.4.3 X7
Another peculiar object in the S cluster is the bow-shock source X7, first reported by Muzic et al. (2007) and analyzed in detail by Mužić et al. (2010), Peißker et al. (2021a), and Shaqil et al. (2025). The evolution of the elongation of X7 was shown by Peißker et al. (2021a), who proposed that a putative outflow from Sgr A* might not be the origin of the bow-shock source. A definite answer for the origin of the bow-shock source is still debated, however, and requires precise knowledge of the orbit of X7. It should be noted that Ciurlo et al. (2023) suggested a comparable nature for X7 as was claimed for G2/DSO (Gillessen et al. 2012). Ciurlo et al. and Gillessen et al. both claimed that X7 and G2/DSO are coreless dust features with a few Earth masses on a Keplerian trajectory orbiting Sgr A*. Although a detailed discussion exceeds the scope of this work, we stress that evaporation timescales of about 10 years for dust with a few 100 K and the ionized gas of ≈ 104 K challenge the existence of dense coreless clouds in the S cluster (Cuadra et al. 2005, 2006; Burkert et al. 2012; Peißker et al. 2024c). Therefore, the proposed inspiral trajectory for X7 was inspected using the high-resolution ERIS data.
2.4.4 X3
The massive candidate YSO X3 is located about 0.1 pc away from the Sgr A* and the S cluster. The object morphology reveals a prominent bow shock that is located inside the minicavity at a distance of less than 0.01 pc from the core region of IRS 13 (Clénet et al. 2003; Clénet et al. 2005; Mužić et al. 2010), which is a peculiar dense association of early-type and Wolf-Rayet stars (Pavlík et al. 2024; Labaj et al. 2025). Peißker et al. (2023b) reported that the K-band emission associated with the stellar source X3a is comoving with the envelope known as X3. Furthermore, it was possible to witness an active accretion event of a massive thermal blob onto X3a. We named this blob X3b and followed its trajectory for almost two decades. Intriguingly, X3b disappeared during the epoch when it approached the tidal (Hill) radius of X3a. Hence, ongoing monitoring of this source allows us to confirm or reject the proposed interpretations.
3 Results
In this section, we show the results of the observations and update existing orbital solutions for the dusty sources in the S cluster based on the increased data baseline. Using recently obtained data, we close the observational gap between the SIN-FONI instrument (decommissioned in 2019) and ERIS (first light in 2022, see Davies et al. 2023). For X3, only observations with a medium plate scale are available (Table 1). Hence, we focus on a quantitative analysis of the massive YSO.
3.1 Source identification
To increase the data baseline of peculiar sources in the Galactic center, it is crucial to identify the objects of interest in the observations executed with ERIS. Using the surveys and related Keplerian solutions presented by Peißker et al. (2020a, 2021a,b, 2023a,b, 2024c,a), the ERIS data can be analyzed at the expected spatial position and the Doppler-shifted wavelength. To estimate the related line-of-sight (LOS) velocity, we used a Gaussian fit of the Doppler-shifted Brγ emission peak. With the known rest wavelength of the Brγ line of 2.1661 μm, we calculated the LOS velocity of the source of interest.
3.1.1 G2/DSO
As for every other stellar source in the S cluster, the identification of G2/DSO was hampered by confusion (Sabha et al. 2012; Eckart et al. 2013) due to high crowding. Unfortunately, the confusion for G2/DSO was increased in epochs after its pericenter passage in 2014.43 by the high stellar density close to Sgr A* (Peißker et al. 2021b). Based on the predicted orbit, this confusion decreased, especially in 2024. Using the high-resolution data listed in Sect. 2, we identified G2/DSO in 2024.22 using ERIS at its expected position on a Keplerian orbit. We found no signatures of any deviation from its proposed trajectory as inferred by Peißker et al. (2021b). In Fig. 2, we show the identification of G2/DSO on its orbital path around Sgr A*. With the detection in 2024, about 25% of the orbital period of about 100 years of G2/DSO is covered (Table 4). Another aspect of the analysis is the Brγ luminosity of G2/DSO. Several predictions of a variable luminosity were made (Gillessen et al. 2012; Ballone et al. 2013; Pfuhl et al. 2015). The data do not support significant variations, however, as shown by Peißker et al. (2024c). For the observational epoch in 2024, we used the K-band flux estimate of 14 × 10−3Jy from Peißker et al. (2024c) of S2 to normalize the IFU data. This flux estimate equals about 7 L⊙ and can be used to directly extract the Brγ from the line map shown in Fig. 2. We found a continuation of the trend of a constant luminosity shown in Fig. 3. With an average Brγ luminosity of LBrγ = (2.42 ± 0.30) × 10−3L⊙, the estimated value agrees with Pfuhl et al. (2015) and Peißker et al. (2024c). The measured luminosity in 2024 of G2/DSO is LBrγ = (2.30 ± 0.31) × 10−3 L⊙, where the uncertainty represents the standard deviation. Overall, we find no signs of any variability, as expected from a stellar object that excites hydrogen at temperatures of several thousand Kelvin.
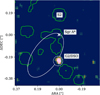 |
Fig. 2 Detection of G2/DSO on its Keplerian orbit with ERIS in 2024. The Brγ line map illustrates the preserved compact shape of G2/DSO and its continued path on a Keplerian orbit. The image is centered on Sgr A* and shows continuum contour lines of the brightest S cluster stars. The location of S2, Sgr A*, and G2/DSO is indicated. North is up, and east is to the left. |
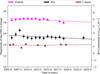 |
Fig. 3 Magnitude and luminosity evolution of G2/DSO. The continuum detection was limited to 2019, but we added a new Brγ luminosity data point representing the ERIS observations in 2024. |
3.1.2 D9
With the increased spectral resolution of ERIS, we identified the binary system D9 in 2023 and 2024 in its descending part of its orbit around Sgr A*. As pointed out by Peißker et al. (2024a) and shown by Peißker et al. (2024c), multiple sources are expected to cross the projected trajectory of D9. Hence, we tested our predictions of the orbits of the dusty sources in 2024. As displayed in Fig. 4, we identified D9 at the expected position on its Keplerian orbit around Sgr A*. Furthermore, we found a source located about 25 mas away from D9. This source is moving northward and was in superposition with D23 in 2019 (see Fig. 1 in Peißker et al. 2024a). Based on the Keplerian approximations presented by Peißker et al. (2020a) and Peißker et al. (2024c), we successfully rediscover edD2 on its orbit2. It is expected that both sources will be superposed between 2025 and 2027. Planned observations should take this potential source of confusion into account.
Considering the Doppler-shifted and periodically varying Brγ emission line of the binary system, we applied corrections that are listed in Table 2 to the observations of D9 in 2023 and 2024. The corrections listed in Table 2 include normalization on the baseline and include the intrinsic arrangement of the binary, both incorporated in the column Base. The barycentric correction is abbreviated with Barycenter and applied in the final velocity. The resulting velocities are shown in Fig. 5, which extends the baseline by two epochs compared to Peißker et al. (2024a). For the inspected Doppler-shifted Brγ-line, we found the periodic signal at its predicted spectroscopic position. With a spectral resolution of ERIS in the inspected K-band range of R = 10000, the 1σ uncertainty is about 15 km/s and comparable to the SINFONI observations. When the systematics are accounted for, the common spectral uncertainties are in the range of 10-15 km/s (Gravity Collaboration 2018). As pointed out by Peißker et al. (2024a), the normalization to the data baseline of ≈125 km/s for D9 was fit for the epochs between 2013 and 2019. This means that the data baseline needs to be updated in the near future when more data are available. For the inspected ERIS data of 2024, we applied a conservative uncertainty of ±15 km/s to each data point to cover the variation of the LOS velocity of D9 on the descending part of its orbit and instrumental and observational systematics. Follow-up studies need to address this change appropriately.
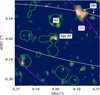 |
Fig. 4 Doppler-shifted Brγ line detection of D9 and D2 with ERIS in 2024. The white orbit plot indicates the trajectory of D9. Furthermore, the path and source are denoted with white arrows. In addition, we include the Keplerian approximation of D2 adapted from Peißker et al. (2020a). The magenta arrows show the source and trajectory of the dusty object D2 that was in superposition with D23 in 2019 (Peißker et al. 2024c). We expect increased confusion for both D9 and D2 from 2025 to 2027. The dusty source D23 moved out of the FOV in 2024 and is not visible in this figure. |
Data points of the binary system D9 observed in 2023 and 2024.
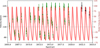 |
Fig. 5 Resulting periodic plot of the D9 binary system. The plot covers almost 20 years of ongoing IFU efforts in the Galactic center, including SINFONI and ERIS. The black data points are based on ERIS observations and are at their expected spectroscopic position. For the gap between 2019 and 2022, no IFU observations of the Galactic center are available. |
3.1.3 X7
Another peculiar object of the S cluster is the bow-shock source X7 (Clénet et al. 2003; Muzic et al. 2010; Peißker et al. 2021a; Ciurlo et al. 2023). We discussed different scenarios for X7 so far that reflect the prominent elongation first reported by Peißker et al. (2021a). We do not discuss an interpretation of the data, but rather the astrometric detection of X7 itself. Because of the limited field of view (FOV) of the ERIS and SINFONI IFU, a comprehensive inspection of the Doppler-shifted Brγ line is limited (Peißker et al. 2021a). Hence, the Keplerian elements we present have a tendency to display the leading part of X73. Compared to Peißker et al. (2021a), we only use the Brγ emission to fit a Keplerian orbit to the trajectory of X7 because of the missing L-band observations. In Fig. 6 we show the observation of X7 in 2024 with its prominent elongation. Considering a projected length of the dust emission of X7 of about 0.3 arcsec in 2021 as displayed in Ciurlo et al. (2023), our measurements of the Doppler-shifted Brγ line emission only covers about 33% because the FOV is limited (Fig. 6). The agreement with our Keplerian approximation is satisfactory, however, as shown in Fig. 6. Due to the orientation of X7 and its proper motion, that is, directed towards the north, we find no indications that the head significantly approaches Sgr A*. This does not entirely exclude that some material might evaporate or be redirected by leaving a bound Keplerian orbit, however.
3.1.4 X3
The majority of sources we investigated are located in the S cluster. One intriguing object can be found in the mini-cavity close to IRS 13 (Fig. 1), however. This source is classified as a massive YSO with a prominent bow shock and is called X3 (Clénet et al. 2003; Mužić et al. 2010; Peißker et al. 2023b). Because it is located outside of the S cluster with an approximately low mean proper motion of about 240 km/s, we focus on a spectroscopic analysis to verify some of the observed features, such as the double peak of the Brγ emission line (Peißker et al. 2023b). There are no observations with the highest plate-scale, and we therefore used the 100 mas setting of the ERIS observation executed in 2023. The resulting spatial pixel scale is 50 mas. In Fig. 7, we show the Brγ emission line of X3. Compared to the spectrum of X3 observed in 2014 with SINFONI, we note an increased intrinsic system velocity for the rediscovered double-peaked Brγ emission line. In order to determine the system LOS velocity, we took the average of Brγblue and Brγred. With the velocities listed in Table 3, we determine a blueshifted system velocity of X3 of −48.5 km/s in 2014. The LOS velocity for the X3 bow-shock system increased to −145.4 km/s in 2023.
In addition to the Brγ doublet shown in Fig. 7, we found some weak signatures of an inverse P Cygni profile depicted in the same figure. The weak signal is spectroscopically located at 2.1667 μm, which corresponds to a redshifted velocity of 83 km/s. The lower Brγ emission intensity of the line at 2.1658 μm might be influenced by the inverse P Cygni absorption feature (Carr & Scarlata 2022). Because of the noise, especially close to the Brγ rest wavelength at 2.1661 μm, and because this putative spectral feature is weak, an artificial origin cannot be excluded.
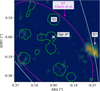 |
Fig. 6 Detection of X7 on its designated Keplerian orbit around Sgr A*. The magenta orbit depicts the Keplerian solution presented by Ciurlo et al. (2023), and the white trajectory is adapted from Peißker et al. (2024c). While the center of gravity of the bow-shock source is located on the white orbit, the tip of X7 follows the magenta trajectory. We stress that the limited FOV blocks emission of X7. In this representation, only about one-third of the bow shock is visible (Peißker et al. 2021a; Ciurlo et al. 2023). |
3.2 Keplerian orbits
To verify or update the orbital solutions of G2/DSO, D9, and X7, we used the ERIS observations executed in 2023 and 2024.
Based on the established reference frame using the SiO masers (Menten et al. 1997; Plewa et al. 2015), the orbit of S2 and hence, the position of SgrA*, is known using different telescopes and instruments (Parsa et al. 2017; Gravity Collaboration 2018; Do et al. 2019a). With a precision of 10% of a pixel with a spatial pixel scale of 12.5 mas, the position of Sgr A* is well known. Including the ongoing monitoring efforts with GRAVITY, the uncertainties for the position of Sgr A* are in the range of a few μas.
From the spectral identification of the Doppler-shifted Brγ line and astrometric detection of the sources of interest presented in Sect. 3.1, we expanded the existing data baseline from 2005 to 2024. The results of the analysis are already incorporated as orbits in the plots (Figs. 2, 4, and 6). At a distance of 8 kpc and a mass for the central gravitational potential Sgr A* of 4 × 10⁶M⊙ (Event Horizon Telescope Collaboration 2022; Peißker et al. 2022), the derived Keplerian elements for the S-cluster sources G2/DSO, D9, and X7 are listed in Table 4. For all three sources listed in Table 4, we only found marginal differences between the published orbital elements and this work. Considering the uncertainties of the updated Keplerian elements that were adapted from the MCMC simulations shown in the appendix, we found marginal differences. While some parameters seem to be constrained in a tighter uncertainty range, such as the semimajor axis, others exceed existing values (e.g., the longitude of the ascending node). We interpret the relation between the old and new uncertainties as a reflection of the noise level of the data. Inspecting the average values of the uncertainty range listed in Table 4, we found deviations between the published orbital elements and this work of about 0-2%. Qualitatively, this is reflected by the confusion-free detection of the sources, as shown in Figs. 2, 4, and 6. Since the Keplerian elements provided by Peißker et al. (2024c) are based on a data baseline that covers the epochs 2005 to 2019, imprecise orbital solutions would be reflected by astrometric deviations of the investigated source sample. Comparing the two orbital solutions, however, we found an averaged deviation of the six Keplerian elements between the old and new orbit of 0.48% for G2/DSO, 1.63% for D9, and 0.21% for X7. The small deviations are expected because we found all sources at their projected astrometric position, as we show in Figs. 2, 4, and 6. The absolute uncertainties of the Keplerian elements are only marginally affected by the longer data baseline, however, which is due to the low orbital coverage of the observations (O’Neil et al. 2019; Ali et al. 2020). The full Keplerian approximations, including the astrometric measurements, are shown in Appendix B.
4 Discussion
In this section, we discuss our findings using NIR ERIS observations of the Galactic center using the Doppler-shifted Brγ emission line. The IFU data observed until 2024 reveal an unprecedented precision of the Keplerian analysis of peculiar objects in the S cluster. We present a qualitative perspective on the SINFONI and ERIS data to underline the capabilities of the new instrument mounted at the VLT. Furthermore, the Doppler-shifted Brγ doublet of X3 is confirmed.
4.1 A comparison of the SINFONI and ERIS data
Based on the monitoring efforts using SINFONI in the Galactic Center by targeting the innermost stars that orbit Sgr A* between 2005 and 2019, we selected three example epochs to compare them with the recent ERIS observations. Because of the dense stellar crowding of the S cluster that is reflected by confused stars or varying background emission that may impact the apparent magnitude, we focused on the brightest S-cluster member in the K band, namely S2 (Habibi et al. 2017). A qualitative strategy is to compare the FHWM of S2 by fitting a Gaussian to the K-band data to measure the impact. Different weather conditions or the general instrument performance might alter the FWHM. Because these sources of influence can be accounted for ERIS and SINFONI, Table 5 provides a snapshot of the data quality of the two IFU instruments and the stability of the FWHM. Table 5 shows that the PSF of ERIS is more stable despite the shorter on-source integration time. The investigated improvements are consistent with the first-light analysis by Davies et al. (2023) and underline the increase in performance of ERIS over SINFONI by almost 10% in the K band with a nominal spatial pixel scale of 25 mas, as reported by George et al. (2016).
The above discussed improvements are reflected in an increased image quality that is demonstrated in Fig. 8. While the ERIS data mosaic exhibits some imperfections, the main difference between the two images is the integration time. The SINFONI data on the left observed in 2014 in Fig. 8 are the culmination of 50 hours of on-source integration time. In contrast, the ERIS observation is constructed from three individual points with 600 sec each, resulting in a total integration time of about 0.5 hours. Although the difference of the integration time in Fig. 8 is on the order of two magnitudes, the ERIS image appears to be sharper. This is not a coincidence, but due to the slightly decreased FWHM of the ERIS data (George et al. 2016; Davies et al. 2023). The reason is the improved optics of ERIS, which effectively reduces PSF distortions.
In the spectroscopic measurements of SINFONI and ERIS, statistical and systematic uncertainties affect the detection of the Doppler-shifted Brγ line. We showed that the OH line transitions (9-7) exceed statistical and systematic uncertainties by a factor of 10-30 (Peißker et al. 2021b). Statistical uncertainties resulting from, for example, a low airmass, high seeing, decreased atmospheric turbulence, and detector performance are challenging to determine. A compromise between these sources of influence are the 1σ uncertainties mentioned in Sect. 3. Especially the Keplerian velocity approximation of the well-observed B2V star S2 shows that spectroscopic uncertainties of ±15km∕s for the IFU data we discussed are justified (Gravity Collaboration 2018).
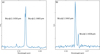 |
Fig. 7 Brγ emission doublet of X3 observed with SINFONI (left plot, a)) and ERIS (right plot, b)) with a plate scale of 100 mas in 2014 and 2023, respectively. For the two Doppler-shifted Brγ peaks in 2014 and 2023, we determine a separation of 1.5 × 10⁻³ μm that equals 200 km/s (Peißker et al. 2023b). The peak values of the lines are listed in Table 3. |
Comparison of the two Brγ doublet detections with SINFONI and ERIS in 2014 and 2023, respectively.
4.2 Astrometric precision
Based on the Keplerian approximation presented by Peißker et al. (2020a) and Peißker et al. (2024c), we traced the most prominent dusty sources in the S cluster at their expected astrometric positions in 2024. With these additional positions, we derived the Keplerian orbital solutions listed in Table 4 and classified them as new (i.e., this work) and old (i.e., Peißker et al. 2020a, 2023a, 2024c). We compare every individual old and new orbital element and derive an individual deviation that is listed in Table 6. As stated in Sect. 3, the averaged uncertainty for G2/DSO, D9, and X7 is 0.48%, 1.63%, and 0.21%, respectively. For the investigated source sample, we estimate an accumulated and averaged uncertainty of 0.77%, which suggests precise knowledge about the previous, current, and upcoming orbital evolution. For all three sources, secular gravitational interactions will induce a non-Keplerian evolution, however, which we discuss in the following subsection. Furthermore, we stress that the nature and orbital evolution of X7 are still under debate (Peißker et al. 2021a; Ciurlo et al. 2014; Shaqil et al. 2025). We cannot exclude the possibility that the orbital elements of X7 will change dramatically in the next observation epochs.
Keplerian elements of the S-cluster objects we analyzed using ERIS.
Qualitative comparison between SINFONI and ERIS data using the PSF of the brightest S-cluster member S2 in the K band.
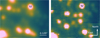 |
Fig. 8 Comparison of S-cluster observations using SINFONI (left) in 2014 and ERIS (right) in 2024. While the left image is the final product of about 50 hours of on-source observations, the right plot was obtained with an integration time of 30 minutes (including overheads). Due to PSF distortions, the left image seems to be smeared. The artifacts in the right image are the result of the insufficient mosaic recipe of ESOREFLEX and the short on-source integration time (Table 5). The images have a spatial pixel scale of 12.5 mas and show the B2V star S2. |
Deviations (in percent) between existing and newly derived orbital elements for the most prominent dusty objects of the S cluster.
4.3 The origin of G2/DSO
The most prominent dusty source of the S cluster is G2/DSO. As the name suggests, an ongoing debate about its nature results in a different morphology and fate of the dusty source (see Zajaček et al. (2014) and Peißker et al. (2021b) for a detailed discussion of different scenarios). An inspiral trajectory of G2/DSO as part of a gas streamer was proposed as one scenario (Pfuhl et al. 2015). This picture was updated by Gillessen et al. (2019) by the claim that a drag force that acts on the gas. Gillessen et al. acknowledged the potential presence of a faint source and described an embedded stellar system enveloped by gas and dust. To resolve the differing conclusion about the nature of G2/DSO, Gillessen et al. (2019) proposed a non-Keplerian motion of the gas that is unavoidably disrupted by the central faint stellar source. According to Gillessen et al., the deviation of the gas (i.e., Doppler-shifted Brγ emission) from a Keplerian orbit should be 5 mas in 2019 and 10 mas in 2021. In 2024.22, we rediscovered G2/DSO at a Gaussian fitted distance to Sgr A* of ∆RA = 0.021 arcsec and ∆Dec = 0.22 arcsec. Compared to the Keplerian orbit, we found a deviation of 5 mas to the measured astrometric position of G2/DSO. At the spatial pixel scale of the ERIS data of 12.5 mas, the estimated deviation of 5 mas is only a fraction of a pixel. Although this component scenario might solve the discrepancy between different proposed natures for G2/DSO, the uncertainty does not allow us a definite statement. We point out that GRAVITY (Gravity Collaboration 2017) and the recent upgrade GRAV-ITY+ (Gravity+ Collaboration 2022) might reduce the astrometric uncertainty by several magnitudes. Because the Brγ luminosity of G2/DSO is LBrγ = (2.30 ± 0.31) × 10−3L⊙ in 2024, the source might be observed with GRAVITY+.
Considering the constant continuum magnitude, Brγ luminosity, and astrometric position, we cannot confirm signatures of an in-spiral motion of G2/DSO as suggested by Gillessen et al. (2019, 2025)4.
4.4 The evolution of D9
The vZLK timescale of  years and the related upper age estimate of the binary system of about 2.7 × 10⁶ years are similar (Peißker et al. 2024a). Hence, the primary (D9a) and secondary (D9b) might merge soon. Thus, a precise monitoring of the orbit of the system is crucial for the detection of any deviations in the Keplerian motion that would indicate the approach of the merger of D9a and D9b (Huang 1956; Hadjidemetriou 1963; Stone et al. 2013). Given the deviation between the orbital elements for the data baseline that covers observations until 2019 and 2024 of 1.63%, we found no signatures that might indicate an upcoming merger. The periodic signal of the binary follows the fit presented by Peißker et al. (2024a), however. We note that the upcoming superposition with D2 (Eckart et al. 2013; Peißker et al. 2020a, 2024c) will affect the detection of D9 by the increased confusion.
4.5 X7 as a tidally stretched gas streamer
Ciurlo et al. (2023) proposed the interesting idea that X7 might be a tidally stretched gas filament. We have discussed this idea in the appendix of Peißker et al. (2021a) and provided a data interpretation in Peißker et al. (2024c). We focus here on the astrometric detection and the related implications. Consistent with the orbit proposed by Peißker et al. (2024c) , which covers a data baseline of about 20 years, we rediscovered X7 at its expected position in 2023 and 2024 using ERIS. The missing L-band coverage in the ERIS data we analyze here means that we limit the analysis to the Doppler-shifted Brγ emission line, as shown in Fig. 6. In the two epochs that were observed with ERIS, we fit a Gaussian to the tip region of the bow shock, which introduced some limitations. In other words, because the FOV does not cover the complete source, our projected data points are systematically offset toward Sgr A*. The two Keplerian approximations agree in the data until 2019 and 2024 to within 0.21%, however. This suggests that X7 still follows the orbital trajectory we proposed and shows no tidally stretched emission along its orbit, as was modeled for comparable sources under the impact of the supermassive black hole (Schartmann et al. 2012; Ballone et al. 2013; Gillessen et al. 2013). Given the prominent elongation of X7, a mass transfer between X7 and Sgr A* cannot be fully excluded. Fig. 6 shows that Ciurlo et al. (2023) used the tip of X7 itself to fit a Keplerian orbit5. If the gravitational pull of Sgr A* can explain the elongation of X7, we expect a detachment of the tip in the upcoming years due to the ongoing elongation.
4.6 The origin of the massive YSO X3
In addition to the formation scenarios proposed by Jalali et al. (2014) and Peißker et al. (2023b), the acceleration of about ∆v ≈ 100 km/s of X3 suggests that the system might be bound to a gravitational potential. When we assume that X3 formed outside the inner parsec, we would expect a significant deceleration, as proposed by Hobbs & Nayakshin (2009). If X3 had formed due to some plunging event in a putative cloud with mass Mcloud, however, the interaction with the ambient medium would have significantly decreased its angular momentum. Hence, we cannot favor a formation scenario based on the observed acceleration of the centroid of the reported Brγ line (Fig. 7). In followup studies, we will inspect the orbital elements of X3 and the surrounding sources in detail to search for common patterns.
5 Conclusion
We used ERIS to monitor peculiar objects in the S cluster to close the gap to SINFONI IFU monitoring efforts that took place between 2005 and 2019. In particular, we focused on G2/DSO, D9, and X7. These high-resolution observations supported by adaptive optics had a spatial pixel scale of 12.5 mas. In addition, we included medium-resolution observations of the mini-cavity and inspected the status of X3, a massive YSO located at a distance of approximately 0.1 parsec toward the supermassive black hole. In the following, we list our key findings:
We found all S cluster sources we investigated at their expected positions;
In comparison to the Keplerian elements that covered a data baseline until 2019, our recent measurements show an accuracy lower than 2% with respect to the original orbital solutions;
We successfully closed the gap between the SINFONI and ERIS observations and focused on peculiar dusty objects;
Since all the sources follow a Keplerian orbit consistent with the literature, several scenarios were analysed;
For G2/DSO, we found no signs of an inspiralling trajectory that would lead to the destruction of the source;
The D9 binary system is still intact and has not merged;
The bow-shock source X7 follows its trajectory northward;
X3, located in the mini-cavity close to the evaporating cluster IRS 13, shows the same double-peak Brγ line in 2023 as observed in 2014;
The centroid of the Brγ doublet associated with X3 accelerated by about 100 km/s;
Further studies will provide more details about the formation history of the massive YSO X3.
For the future, we will strengthen our efforts to monitor peculiar sources in the inner parsec and reduce the uncertainties to less than 1%. This is reflected by scheduled James Webb space telescope observations or proposed observations with mid-infrared ELT imager and spectrograph (METIS), a first-generation instrument for the extremely large telescope operating in the MIR (Brandl et al. 2021).
Acknowledgements
We would like to thank the anonymous referee for the prompt and thorough reports that helped us improve this paper. FP, EB, and MM gratefully acknowledge the Collaborative Research Center 1601 funded by the Deutsche Forschungsgemeinschaft (DFG, German Research Foundation) - SFB 1601 [sub-project A3] - 500700252. MZ acknowledges the GAČR JUNIOR STAR grant no. GM24-10599M for financial support. VK has been partially supported by the Collaboration Project (ref. GF23-04053L –2021/43/I/ST9/01352/OPUS 22). VP is funded by the European Union’s Horizon Europe and the Central Bohemian Region under the Marie Sklodowska-Curie Actions - COFUND, Grant agreement ID:101081195 (“MERIT”). VK and VP also acknowledge support from the project RVO:67985815 at the Czech Academy of Sciences. MM was supported for this research through a stipend from the International Max Planck Research School (IMPRS) for Astronomy and Astrophysics at the Universities of Bonn and Cologne. MS is supported by the Grant Agency of Charles University under the grant number 179123. AP, SE, JC, and GB contributed useful points to the discussion. We also would like to thank the members of the SINFONI/NACO and ESO’s Paranal/Chile team for their support and collaboration. This paper makes use of the following ALMA data: ADS/JAO.ALMA#2016.1.00870.S. ALMA is a partnership of ESO (representing its member states), NSF (USA) and NINS (Japan), together with NRC (Canada), MOST and ASIAA (Taiwan), and KASI (Republic of Korea), in cooperation with the Republic of Chile. The Joint ALMA Observatory is operated by ESO, AUI/NRAO and NAOJ.
References
- Ali, B., Paul, D., Eckart, A., et al. 2020, ApJ, 896, 100 [NASA ADS] [CrossRef] [Google Scholar]
- Ballone, A., Schartmann, M., Burkert, A., et al. 2013, ApJ, 776, 13 [NASA ADS] [CrossRef] [Google Scholar]
- Bartko, H., Martins, F., Fritz, T. K., et al. 2009, ApJ, 697, 1741 [Google Scholar]
- Bonnell, I. A., & Rice, W. K. M. 2008, Science, 321, 1060 [NASA ADS] [CrossRef] [Google Scholar]
- Brandl, B., Bettonvil, F., van Boekel, R., et al. 2021, The Messenger, 182, 22 [NASA ADS] [Google Scholar]
- Burkert, A., Schartmann, M., Alig, C., et al. 2012, ApJ, 750, 58 [CrossRef] [Google Scholar]
- Carr, C., & Scarlata, C. 2022, ApJ, 939, 47 [Google Scholar]
- Ciurlo, A., & Morris, M. R. 2026, in Encyclopedia of Astrophysics, 4, 1 [Google Scholar]
- Ciurlo, A., Paumard, T., Rouan, D., & Clénet, Y. 2014, in IAU Symposium, 303, The Galactic Center: Feeding and Feedback in a Normal Galactic Nucleus, eds. L. O. Sjouwerman, C. C. Lang, & J. Ott, 83 [Google Scholar]
- Ciurlo, A., Campbell, R. D., Morris, M. R., et al. 2020, Nature, 577, 337 [Google Scholar]
- Ciurlo, A., Campbell, R. D., Morris, M. R., et al. 2023, ApJ, 944, 136 [NASA ADS] [CrossRef] [Google Scholar]
- Clénet, Y., Rouan, D., Gratadour, D., Gendron, E., & Lacombe, F. 2003, in SF2A-2003: Semaine de l’Astrophysique Francaise, eds. F. Combes, D. Barret, T. Contini, & L. Pagani, 163 [Google Scholar]
- Clénet, Y., Rouan, D., Gratadour, D., Gendron, E., & Lacombe, F. 2005, in Science with Adaptive Optics, eds. W. Brandner, & M. E. Kasper (Berlin, Heidelberg: Springer Berlin Heidelberg), 286 [Google Scholar]
- Cuadra, J., Nayakshin, S., Springel, V., & Di Matteo, T. 2005, MNRAS, 360, L55 [CrossRef] [Google Scholar]
- Cuadra, J., Nayakshin, S., Springel, V., & Di Matteo, T. 2006, MNRAS, 366, 358 [NASA ADS] [CrossRef] [Google Scholar]
- Davies, R., Esposito, S., Schmid, H. M., et al. 2018, SPIE Conf. Ser., 10702, 1070209 [Google Scholar]
- Davies, R., Absil, O., Agapito, G., et al. 2023, A&A, 674, A207 [NASA ADS] [CrossRef] [EDP Sciences] [Google Scholar]
- Do, T., Hees, A., Ghez, A., et al. 2019a, Science, 365, 664 [Google Scholar]
- Do, T., Witzel, G., Gautam, A. K., et al. 2019b, ApJ, 882, L27 [NASA ADS] [CrossRef] [Google Scholar]
- Eckart, A., Schödel, R., García-Marín, M., et al. 2008, A&A, 492, 337 [CrossRef] [EDP Sciences] [Google Scholar]
- Eckart, A., García-Marín, M., Vogel, S. N., et al. 2012, A&A, 537, A52 [NASA ADS] [CrossRef] [EDP Sciences] [Google Scholar]
- Eckart, A., Muzic, K., Yazici, S., et al. 2013, A&A, 551, A18 [NASA ADS] [CrossRef] [EDP Sciences] [Google Scholar]
- Eckart, A., Hüttemann, A., Kiefer, C., et al. 2017, Found. Phys., 47, 553 [NASA ADS] [CrossRef] [Google Scholar]
- Eisenhauer, F., Genzel, R., Alexander, T., et al. 2005, ApJ, 628, 246 [Google Scholar]
- ESO 2012, GASGANO: Data File Organizer, Astrophysics Source Code Library [record ascl:1210.020] [Google Scholar]
- Event Horizon Telescope Collaboration (Akiyama, K., et al.) 2022, ApJ, 930, L12 [NASA ADS] [CrossRef] [Google Scholar]
- Freudling, W., Romaniello, M., Bramich, D. M., et al. 2013, A&A, 559, A96 [NASA ADS] [CrossRef] [EDP Sciences] [Google Scholar]
- Genzel, R. 2022, Rev. Mod. Phys., 94, 020501 [NASA ADS] [CrossRef] [Google Scholar]
- George, E. M., Gräff, D., Feuchtgruber, H., et al. 2016, SPIE Conf. Ser., 9908, 99080G [Google Scholar]
- Gillessen, S., Eisenhauer, F., Trippe, S., et al. 2009, ApJ, 692, 1075 [NASA ADS] [CrossRef] [Google Scholar]
- Gillessen, S., Genzel, R., Fritz, T. K., et al. 2012, Nature, 481, 51 [Google Scholar]
- Gillessen, S., Genzel, R., Fritz, T. K., et al. 2013, ApJ, 763, 78 [NASA ADS] [CrossRef] [Google Scholar]
- Gillessen, S., Plewa, P. M., Widmann, F., et al. 2019, ApJ, 871, 126 [NASA ADS] [CrossRef] [Google Scholar]
- Gillessen, S., Eisenhauer, F., Cuadra, J., et al. 2025, arXiv e-prints [arXiv:2510.00897] [Google Scholar]
- Gravity Collaboration (Abuter, R., et al.) 2017, A&A, 602, A94 [NASA ADS] [CrossRef] [EDP Sciences] [Google Scholar]
- Gravity Collaboration (Abuter, R., et al.) 2018, A&A, 615, L15 [NASA ADS] [CrossRef] [EDP Sciences] [Google Scholar]
- Gravity+ Collaboration (Abuter, R., et al.) 2022, The Messenger, 189, 17 [NASA ADS] [Google Scholar]
- Haas, J., & Šubr, L. 2016, ApJ, 822, 25 [Google Scholar]
- Haas, J., & Šubr, L. 2021, ApJ, 922, 74 [Google Scholar]
- Haas, J., Šubr, L., & Vokrouhlický, D. 2011, MNRAS, 416, 1023 [Google Scholar]
- Habibi, M., Gillessen, S., Martins, F., et al. 2017, ApJ, 847, 120 [Google Scholar]
- Hadjidemetriou, J. D. 1963, Icarus, 2, 440 [NASA ADS] [CrossRef] [Google Scholar]
- Hobbs, A., & Nayakshin, S. 2009, MNRAS, 394, 191 [NASA ADS] [CrossRef] [Google Scholar]
- Huang, S. S. 1956, AJ, 61, 49 [NASA ADS] [CrossRef] [Google Scholar]
- Jalali, B., Pelupessy, F. I., Eckart, A., et al. 2014, MNRAS, 444, 1205 [NASA ADS] [CrossRef] [Google Scholar]
- Jia, S., Xu, N., Lu, J. R., et al. 2023, ApJ, 949, 18 [NASA ADS] [CrossRef] [Google Scholar]
- Kozai, Y. 1962, AJ, 67, 591 [Google Scholar]
- Kuntschner, H., Jochum, L., Amico, P., et al. 2014, SPIE Conf. Ser., 9147, 91471U [Google Scholar]
- Labaj, M., Ressler, S. M., Zajaček, M., et al. 2025, A&A, 702, A233 [NASA ADS] [CrossRef] [EDP Sciences] [Google Scholar]
- Lidov, M. L. 1962, Planet. Space Sci., 9, 719 [Google Scholar]
- Lithwick, Y., & Naoz, S. 2011, ApJ, 742, 94 [NASA ADS] [CrossRef] [Google Scholar]
- Lu, J. R., Ghez, A. M., Hornstein, S. D., et al. 2009, ApJ, 690, 1463 [NASA ADS] [CrossRef] [Google Scholar]
- Maillard, J. P., Paumard, T., Stolovy, S. R., & Rigaut, F. 2004, A&A, 423, 155 [NASA ADS] [CrossRef] [EDP Sciences] [Google Scholar]
- Marchetti, E., Fedrigo, E., Le Louarn, M., et al. 2014, SPIE Conf. Ser., 9148, 914826 [Google Scholar]
- Menten, K. M., Reid, M. J., Eckart, A., & Genzel, R. 1997, ApJ, 475, L111 [Google Scholar]
- Muzic, K., Eckart, A., Schödel, R., Meyer, L., & Zensus, A. 2007, A&A, 469, 993 [NASA ADS] [CrossRef] [EDP Sciences] [Google Scholar]
- Mužić, K., Eckart, A., Schödel, R., et al. 2010, A&A, 521, A13 [NASA ADS] [CrossRef] [EDP Sciences] [Google Scholar]
- O’Neil, K. K., Martinez, G. D., Hees, A., et al. 2019, AJ, 158, 4 [Google Scholar]
- Parsa, M., Eckart, A., Shahzamanian, B., et al. 2017, ApJ, 845, 22 [NASA ADS] [CrossRef] [Google Scholar]
- Paumard, T., Genzel, R., Martins, F., et al. 2006, ApJ, 643, 1011 [NASA ADS] [CrossRef] [Google Scholar]
- Pavlík, V., Karas, V., Bhat, B., Peißker, F., & Eckart, A. 2024, A&A, 692, A104 [NASA ADS] [CrossRef] [EDP Sciences] [Google Scholar]
- Pearson, D., Taylor, W., Davies, R., et al. 2016, SPIE Conf. Ser., 9908, 99083F [Google Scholar]
- Peißker, F., Zajaček, M., Eckart, A., et al. 2019, A&A, 624, A97 [NASA ADS] [CrossRef] [EDP Sciences] [Google Scholar]
- Peißker, F., Hosseini, S. E., Zajaček, M., et al. 2020a, A&A, 634, A35 [NASA ADS] [CrossRef] [EDP Sciences] [Google Scholar]
- Peißker, F., Eckart, A., Zajaček, M., Ali, B., & Parsa, M. 2020b, ApJ, 899, 50 [CrossRef] [Google Scholar]
- Peißker, F., Ali, B., Zajaček, M., et al. 2021a, ApJ, 909, 62 [CrossRef] [Google Scholar]
- Peißker, F., Zajaček, M., Eckart, A., et al. 2021b, ApJ, 923, 69 [CrossRef] [Google Scholar]
- Peißker, F., Eckart, A., Zajaček, M., & Britzen, S. 2022, ApJ, 933, 49 [CrossRef] [Google Scholar]
- Peißker, F., Zajaček, M., Eckart, A., et al. 2023a, ApJ, 943, 183 [CrossRef] [Google Scholar]
- Peißker, F., Zajaček, M., Sabha, N. B., et al. 2023b, ApJ, 944, 231 [CrossRef] [Google Scholar]
- Peißker, F., Zajaček, M., Thomkins, L., et al. 2023c, ApJ, 956, 70 [CrossRef] [Google Scholar]
- Peißker, F., Zajaček, M., Labadie, L., et al. 2024a, Nat. Commun., 15, 10608 [Google Scholar]
- Peißker, F., Zajaček, M., Labaj, M., et al. 2024b, ApJ, 970, 74 [CrossRef] [Google Scholar]
- Peißker, F., Zajaček, M., Melamed, M., et al. 2024c, A&A, 686, A235 [NASA ADS] [CrossRef] [EDP Sciences] [Google Scholar]
- Pfuhl, O., Gillessen, S., Eisenhauer, F., et al. 2015, ApJ, 798, 111 [NASA ADS] [CrossRef] [Google Scholar]
- Plewa, P. M., Gillessen, S., Eisenhauer, F., et al. 2015, MNRAS, 453, 3234 [Google Scholar]
- Rousselot, P., Lidman, C., Cuby, J. G., Moreels, G., & Monnet, G. 2000, A&A, 354, 1134 [Google Scholar]
- Sabha, N., Eckart, A., Merritt, D., et al. 2012, A&A, 545, A70 [NASA ADS] [CrossRef] [EDP Sciences] [Google Scholar]
- Schartmann, M., Burkert, A., Alig, C., et al. 2012, ApJ, 755, 155 [NASA ADS] [CrossRef] [Google Scholar]
- Schödel, R., Ott, T., Genzel, R., et al. 2002, Nature, 419, 694 [Google Scholar]
- Shahzamanian, B., Eckart, A., Zajaček, M., et al. 2016, A&A, 593, A131 [NASA ADS] [CrossRef] [EDP Sciences] [Google Scholar]
- Shahzamanian, B., Zajaček, M., Valencia-S., M., et al. 2017, in The Multi Messenger Astrophysics of the Galactic Centre, 322, eds. R. M. Crocker, S. N. Longmore, & G. V. Bicknell, 233 [Google Scholar]
- Shaqil, W., Calderón, D., Rosswog, S., et al. 2025, A&A, 700, A134 [NASA ADS] [CrossRef] [EDP Sciences] [Google Scholar]
- Singhal, M., Šubr, L., & Haas, J. 2024, MNRAS, 531, 2028 [CrossRef] [Google Scholar]
- Sitarski, B. N. 2016, PhD thesis, University of California, Los Angeles [Google Scholar]
- Stephan, A. P., Naoz, S., Ghez, A. M., et al. 2016, MNRAS, 460, 3494 [NASA ADS] [CrossRef] [Google Scholar]
- Stone, N., Sari, R., & Loeb, A. 2013, MNRAS, 435, 1809 [NASA ADS] [CrossRef] [Google Scholar]
- Šubr, L., Schovancová, J., & Kroupa, P. 2009, A&A, 496, 695 [NASA ADS] [CrossRef] [EDP Sciences] [Google Scholar]
- Suková, P., Zajaček, M., Witzany, V., & Karas, V. 2021, ApJ, 917, 43 [CrossRef] [Google Scholar]
- Trippe, S., Davies, R., Eisenhauer, F., et al. 2010, MNRAS, 402, 1126 [NASA ADS] [CrossRef] [Google Scholar]
- Tsuboi, M., Asaki, Y., Yonekura, Y., et al. 2013, The Astronomer’s Telegram, 4923 [Google Scholar]
- Tsuboi, M., Asaki, Y., Kameya, O., et al. 2015, ApJ, 798, L6 [Google Scholar]
- Valencia-S., M., Eckart, A., Zajaček, M., et al. 2015, ApJ, 800, 125 [NASA ADS] [CrossRef] [Google Scholar]
- von Fellenberg, S. D., Gillessen, S., Stadler, J., et al. 2022, ApJ, 932, L6 [NASA ADS] [CrossRef] [Google Scholar]
- von Zeipel, H. 1910, Astron. Nachr., 183, 345 [Google Scholar]
- Šubr, L., Schovancová, J., & Kroupa, P. 2009, A&A, 496, 695 [NASA ADS] [CrossRef] [EDP Sciences] [Google Scholar]
- Witzel, G., Ghez, A. M., Morris, M. R., et al. 2014, ApJ, 796, L8 [NASA ADS] [CrossRef] [Google Scholar]
- Witzel, G., Martinez, G., Hora, J., et al. 2018, ApJ, 863, 15 [NASA ADS] [CrossRef] [Google Scholar]
- Witzel, G., Martinez, G., Willner, S. P., et al. 2021, ApJ, 917, 73 [NASA ADS] [CrossRef] [Google Scholar]
- Yusef-Zadeh, F., Roberts, D., Wardle, M., Heinke, C. O., & Bower, G. C. 2006, ApJ, 650, 189 [NASA ADS] [CrossRef] [Google Scholar]
- Yusef-Zadeh, F., Bushouse, H., Arendt, R. G., et al. 2025, ApJ, 980, L35 [Google Scholar]
- Zajaček, M., Karas, V., & Eckart, A. 2014, A&A, 565, A17 [NASA ADS] [CrossRef] [EDP Sciences] [Google Scholar]
- Zajaček, M., Britzen, S., Eckart, A., et al. 2017, A&A, 602, A121 [NASA ADS] [CrossRef] [EDP Sciences] [Google Scholar]
- Zajaček, M., Pikhartová, M., & Peissker, F. 2024, arXiv e-prints [arXiv:2410.00304] [Google Scholar]
Sitarski (2016) and Ciurlo et al. (2020) referred to D2 as G3.
See Figure 4 in Peißker et al. (2021a).
We note that the recently found object G3 by Gillessen et al. (2025) shares astrometric and spectroscopic similarities with OS2 (Peißker et al. 2021b).
See Fig. 11 of Ciurlo et al. (2023) to inspect the methods they used to fit an orbit to the trajectory of X7.
Appendix A Finding chart data
The data for the finding chart presented in Fig. 1 is listed in Table A.1.
Appendix B Keplerian orbital solutions
In this Appendix, we provide a complete overview of the Keplerian fit solutions of the most prominent dusty S cluster objects.
The orbital elements of the dusty S cluster objects are listed in Table 4. The related fit and data points are shown in Fig. B.1, Fig. B.2, and Fig. B.3. We highlight the detection of all three objects at their expected R.A. and DEC astrometric positions.
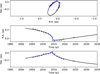 |
Fig. B.1 Keplerian fit of the astrometric positions of G2/DSO until 2024. The data includes SINFONI and ERIS observations of the Galactic center. |
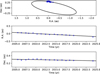 |
Fig. B.2 Orbital solution for the Keplerian approximation for D9 including observations until 2024. |
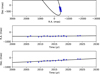 |
Fig. B.3 Evolution of the bow shock source X7. The plot shows the Keplerian fit of the astrometric positions of X7. |
Appendix C Spectra of the dusty objects
In this subsection, we describe the extraction of the spectrum that results in the detection of the dusty sources analyzed in this work. The most common procedures of extracting a spectrum in the inner parsec is done using two different methods listed below.
Direct source selection with a distant background with almost no stellar emission (Eisenhauer et al. 2005)
Direct source selection with using a circular-annular aperture that subtracts the closest background (Valencia-S. et al. 2015)
Both methods listed above have their scientific justification discussed in the related publication. For the S/N indicated in Table 5, we used neither of the methods but selected directly the dusty objects without a local or distant background subtraction. As an example, we show the process of the spectral extraction in Fig. C.1 for X7 in the ERIS data observed in 2024.22. For this, we manually select the source of interest directly in the data and produce the spectra that are shown in Fig. C.2–C.4. As mentioned in the caption of Table 5, we used a lower limit for the indicated S/N because the measurement of this parameter is affected by the background and source selection. Another aspect, that can not be neglected, is the high stellar density in the S cluster. While the S/N might be higher, Table 5 shows conservative measurements. In the following, we will guide reader through the process of determining the S/N using the faint dusty source G2/DSO that is shown in Fig. C.2. As mentioned, we directly select the source using an aperture that consists of five pixels. The grey spectrum in Fig. C.2 is not background corrected and approximated with an Asymmetric Least Squares (ASL) fit shown as a red curve. The slope of this fit curve is subtracted from the grey spectrum which results in the final blue spectra (Fig. C.2). Due to insufficient cosmic-ray correction, we manually mask all non-linear spectral features. Finally, we use the resulting spectrum, which is corrected for the underlying continuum slope, as the basis for the S/N. In Fig. C.2, we show a zoomed-in window that represent the spectral region around the Dopplershifted Brγ emission line of the related source.
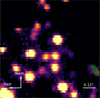 |
Fig. C.1 K-band observation of the S cluster using ERIS in 2024. On the right-hand side of the limited FOV, the bow-shock source X7 is located. The shown plot is created by selecting the IFU channels of the related Doppler-shifted Brγ signal. Therefore, this image represents the product of the line and continuum emission of X7. From this visual inspection, we select the source and extract the spectrum that is presented in this section. |
The final analyzed spectrum in shown in blue in Fig. C.2–C.4 where we fit a Gaussian to the Doppler-shifted Brγ emission line. The 1σ uncertainties of the Gaussian fit are 2.7 km/s and 3.9 km/s for X7 (Fig. C.4) and D9 (Fig. C.3), respectively. As discussed in Sec. 4 and mentioned in Peißker et al. (2021b), OH lines may impact the Doppler-shifted Brγ emission measured in this work. For the spectrum of G2/DSO shown in Fig. C.2, the Gaussian may be impacted by the OH line emission at 2.158μm (Rousselot et al. 2000), resulting in a fit uncertainty of 8.9 km/s. From these measurements, the S/N are determined and listed in Table C.1. We use the amplitude of the signal and divide it by the standard deviation of the continuum below and above the Dopper-shifted Brγ peak. For the S/N listed in Table 5, we use conservative values of G2/DSO. Depending on the source, the S/N is better as outlined in Table C.1. We want to stress that close-by stellar sources in the crowded S cluster do have a significant impact on the quality of the extracted spectrum.
Estimated S/N for the dusty sources
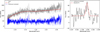 |
Fig. C.2 K-band spectrum of G2/DSO observed with ERIS in 2024. The grey spectrum represents the extracted data from the IFU cube, the blue one is corrected for the continuum slope using an Asymmetric Least Squares fit. The zoomed-in box depicts the spectral region around the Doppler-shifted peak. The Gaussian fit compared to the continuum results in a S/N of 4.3. |
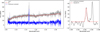 |
Fig. C.3 K-band spectrum of D9 observed with ERIS in 2024. |
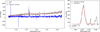 |
Fig. C.4 K-band spectrum of X7 observed with ERIS in 2024. |
Appendix D Incomplete orbits
As pointed out in O’Neil et al. (2019), the low orbital coverage of S cluster members may result in an observable-biased prior which alters the derived Keplerian approximation. In Ali et al. (2020), we adressed this problem by dividing the stellar sample in three groups that can be distinguished by the orbital coverage of the investigated source. The first group contains sources with an orbital coverage of 40 – 100% and for the second one, we defined a range of 20 – 35%. The dusty sources G2/DSO and D9 are in the last group with an orbital coverage of 5 – 15%, resulting in a difference of ≈ 0.6σ between the observable-biased prior and the uniform priors used in this work for the distance and mass of Sgr A*. For X7, the situation is more complex because of the ongoing elongation of the bow shock source. While some authors prefer a core-less model that will lead to the destruction of X7 (Ciurlo et al. 2023; Shaqil et al. 2025), we have shown in this work that the bow shock source continues its path on a Keplerian orbit. While the deviation between the observed location of X7 and the inspiral orbit of Cirulo et al. increases (Fig. 6), it can not be excluded that the Keplerian orbit will change dramatically due to material that is stripped away from the source. Hence, all uncertainties given in this work regarding X7 are limited to the inspected data set and may not represent the evolution of the trajectory. As we already pointed out in Peißker et al. (2021a), there may have been a destructive or at least disturbing event in 2010 that may have resulted in the instability of X7. Speculatively, the presence of a binary in an optically thick envelope may explain the unusual behavior of X7 (Peißker et al. 2024a). Currently, only GRAVITY may answer the intriguing question about the possibility of a binary system inside the bright dusty L band envelope. In the future, observations with MICADO and METIS (ELT) will provide a definitive answer to the question about the nature of X7.
Appendix E MCMC simulations
The MCMC simulations were performed in a similar way as it was done in Peißker et al. (2020b, 2021b, 2022, 2023c, 2024c). We use the results of the Keplerian fit as the apriori distribution. From the fits presented in Fig. E.1–E.3 we extract the 1σ posterior uncertainty distribution. Since the uncertainty range seems slightly asymmetric with a marginal lower limit, we use the upper limit to cover aspects of the data that may be underrepresented in the fit. As pointed out by O’Neil et al. (2019), the orbital coverage of some S cluster members is low compared to their complete trajectory. Due to different background scenarios and nearby stars, any object in the S cluster suffer from multiple sources of interference that are not reflected in the here presented uncertainty range. This problem becomes evident by looking at the simulated expected observations with MICADO, a future instrument at the ELT Trippe et al. (2010). The background in the S cluster may be dominant for fainter sources which potentially lead to astrometric deviations outside of the uncertainty range listed in 4 or discussed in O’Neil et al. (2019). We refer the interested reader to Peißker et al. (2022) for a discussion about the chances of observing stars close to the detection limit. Furthermore, we want to stress that the impact of all sources of influence decreases with an increasing data baseline.
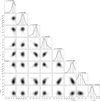 |
Fig. E.1 MCMC simulations of G2/DSO. As an input of the simulations, we use the Keplerian fit results listed in Table 4. |
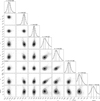 |
Fig. E.2 MCMC simulations of D9. |
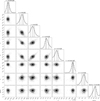 |
Fig. E.3 MCMC simulations of X7. |
All Tables
Comparison of the two Brγ doublet detections with SINFONI and ERIS in 2014 and 2023, respectively.
Qualitative comparison between SINFONI and ERIS data using the PSF of the brightest S-cluster member S2 in the K band.
Deviations (in percent) between existing and newly derived orbital elements for the most prominent dusty objects of the S cluster.
All Figures
|
Fig. 1 Multiwavelength finding chart of the inner ≈0.8 pc of the Galactic center. For this representation of the fraction of the inner parsec, we used ALMA continuum data observed at (9.99 ± 1.58)×1010 Hz, which are represented as green in the plot. The red background image and blue emission was observed with NACO in the K- and L-band, respectively. We overlay the plot with the Doppler-shifted Brγ emission line observed at 2.1648 μm using ERIS (magenta) and a related width of ±330 km/s. The contour lines represent 9%, 13%, 26%, 30%, 43%, and 65% of the peak emission of IRS 13 of about 0.9 × 10⁻⁶W/cm2 (Maillard et al. 2004). |
| In the text | |
|
Fig. 2 Detection of G2/DSO on its Keplerian orbit with ERIS in 2024. The Brγ line map illustrates the preserved compact shape of G2/DSO and its continued path on a Keplerian orbit. The image is centered on Sgr A* and shows continuum contour lines of the brightest S cluster stars. The location of S2, Sgr A*, and G2/DSO is indicated. North is up, and east is to the left. |
| In the text | |
|
Fig. 3 Magnitude and luminosity evolution of G2/DSO. The continuum detection was limited to 2019, but we added a new Brγ luminosity data point representing the ERIS observations in 2024. |
| In the text | |
|
Fig. 4 Doppler-shifted Brγ line detection of D9 and D2 with ERIS in 2024. The white orbit plot indicates the trajectory of D9. Furthermore, the path and source are denoted with white arrows. In addition, we include the Keplerian approximation of D2 adapted from Peißker et al. (2020a). The magenta arrows show the source and trajectory of the dusty object D2 that was in superposition with D23 in 2019 (Peißker et al. 2024c). We expect increased confusion for both D9 and D2 from 2025 to 2027. The dusty source D23 moved out of the FOV in 2024 and is not visible in this figure. |
| In the text | |
|
Fig. 5 Resulting periodic plot of the D9 binary system. The plot covers almost 20 years of ongoing IFU efforts in the Galactic center, including SINFONI and ERIS. The black data points are based on ERIS observations and are at their expected spectroscopic position. For the gap between 2019 and 2022, no IFU observations of the Galactic center are available. |
| In the text | |
|
Fig. 6 Detection of X7 on its designated Keplerian orbit around Sgr A*. The magenta orbit depicts the Keplerian solution presented by Ciurlo et al. (2023), and the white trajectory is adapted from Peißker et al. (2024c). While the center of gravity of the bow-shock source is located on the white orbit, the tip of X7 follows the magenta trajectory. We stress that the limited FOV blocks emission of X7. In this representation, only about one-third of the bow shock is visible (Peißker et al. 2021a; Ciurlo et al. 2023). |
| In the text | |
|
Fig. 7 Brγ emission doublet of X3 observed with SINFONI (left plot, a)) and ERIS (right plot, b)) with a plate scale of 100 mas in 2014 and 2023, respectively. For the two Doppler-shifted Brγ peaks in 2014 and 2023, we determine a separation of 1.5 × 10⁻³ μm that equals 200 km/s (Peißker et al. 2023b). The peak values of the lines are listed in Table 3. |
| In the text | |
|
Fig. 8 Comparison of S-cluster observations using SINFONI (left) in 2014 and ERIS (right) in 2024. While the left image is the final product of about 50 hours of on-source observations, the right plot was obtained with an integration time of 30 minutes (including overheads). Due to PSF distortions, the left image seems to be smeared. The artifacts in the right image are the result of the insufficient mosaic recipe of ESOREFLEX and the short on-source integration time (Table 5). The images have a spatial pixel scale of 12.5 mas and show the B2V star S2. |
| In the text | |
|
Fig. B.1 Keplerian fit of the astrometric positions of G2/DSO until 2024. The data includes SINFONI and ERIS observations of the Galactic center. |
| In the text | |
|
Fig. B.2 Orbital solution for the Keplerian approximation for D9 including observations until 2024. |
| In the text | |
|
Fig. B.3 Evolution of the bow shock source X7. The plot shows the Keplerian fit of the astrometric positions of X7. |
| In the text | |
|
Fig. C.1 K-band observation of the S cluster using ERIS in 2024. On the right-hand side of the limited FOV, the bow-shock source X7 is located. The shown plot is created by selecting the IFU channels of the related Doppler-shifted Brγ signal. Therefore, this image represents the product of the line and continuum emission of X7. From this visual inspection, we select the source and extract the spectrum that is presented in this section. |
| In the text | |
|
Fig. C.2 K-band spectrum of G2/DSO observed with ERIS in 2024. The grey spectrum represents the extracted data from the IFU cube, the blue one is corrected for the continuum slope using an Asymmetric Least Squares fit. The zoomed-in box depicts the spectral region around the Doppler-shifted peak. The Gaussian fit compared to the continuum results in a S/N of 4.3. |
| In the text | |
|
Fig. C.3 K-band spectrum of D9 observed with ERIS in 2024. |
| In the text | |
|
Fig. C.4 K-band spectrum of X7 observed with ERIS in 2024. |
| In the text | |
|
Fig. E.1 MCMC simulations of G2/DSO. As an input of the simulations, we use the Keplerian fit results listed in Table 4. |
| In the text | |
|
Fig. E.2 MCMC simulations of D9. |
| In the text | |
|
Fig. E.3 MCMC simulations of X7. |
| In the text | |
Current usage metrics show cumulative count of Article Views (full-text article views including HTML views, PDF and ePub downloads, according to the available data) and Abstracts Views on Vision4Press platform.
Data correspond to usage on the plateform after 2015. The current usage metrics is available 48-96 hours after online publication and is updated daily on week days.
Initial download of the metrics may take a while.