Fig. C.1
Download original image
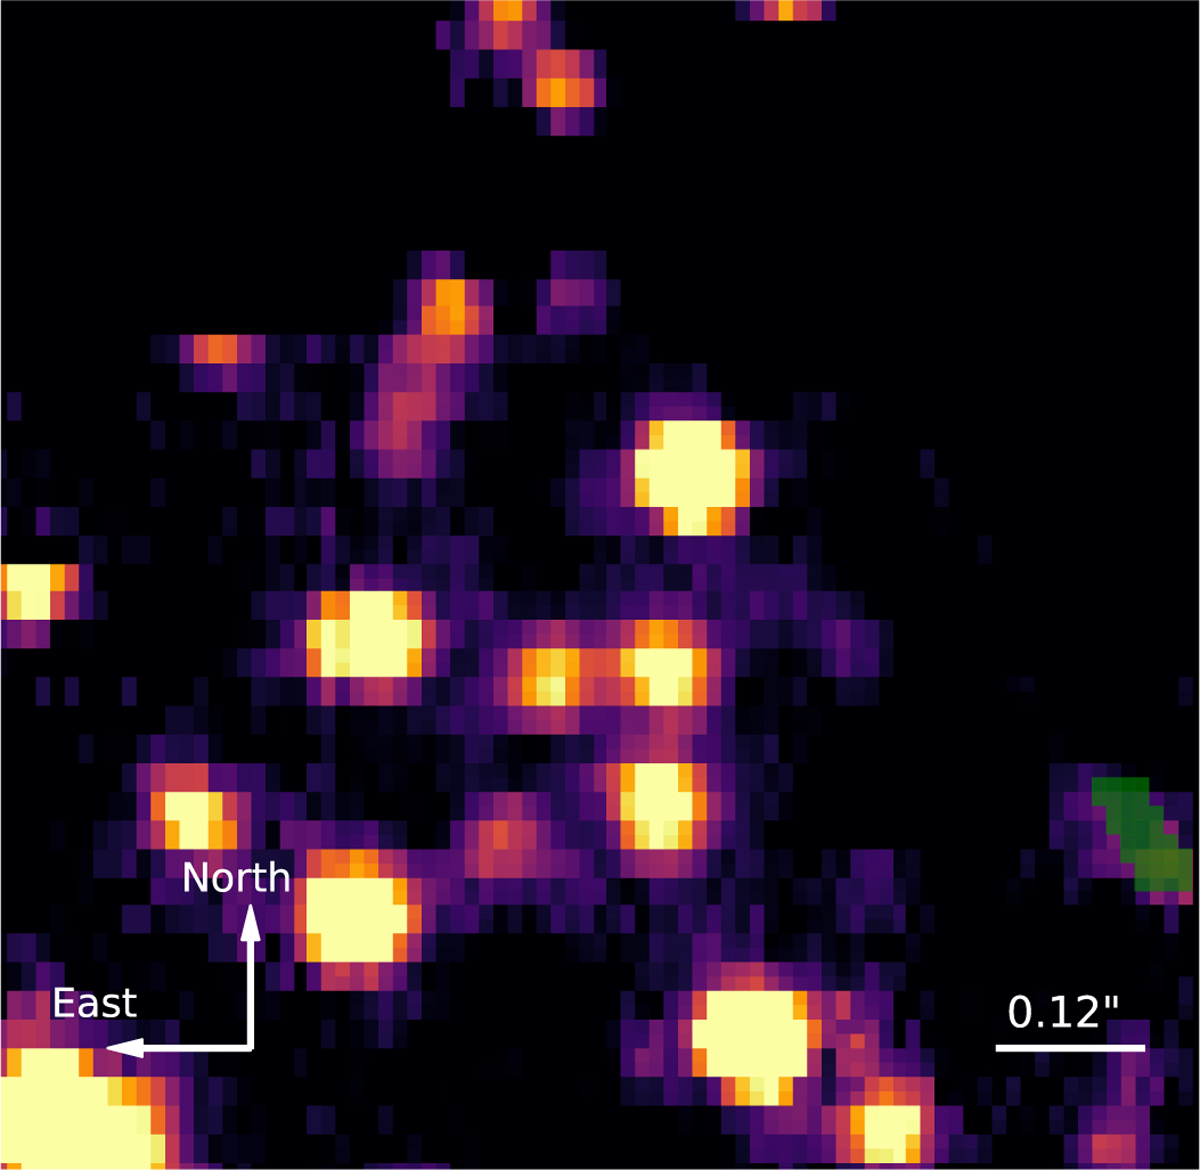
K-band observation of the S cluster using ERIS in 2024. On the right-hand side of the limited FOV, the bow-shock source X7 is located. The shown plot is created by selecting the IFU channels of the related Doppler-shifted Brγ signal. Therefore, this image represents the product of the line and continuum emission of X7. From this visual inspection, we select the source and extract the spectrum that is presented in this section.
Current usage metrics show cumulative count of Article Views (full-text article views including HTML views, PDF and ePub downloads, according to the available data) and Abstracts Views on Vision4Press platform.
Data correspond to usage on the plateform after 2015. The current usage metrics is available 48-96 hours after online publication and is updated daily on week days.
Initial download of the metrics may take a while.