Fig. 8
Download original image
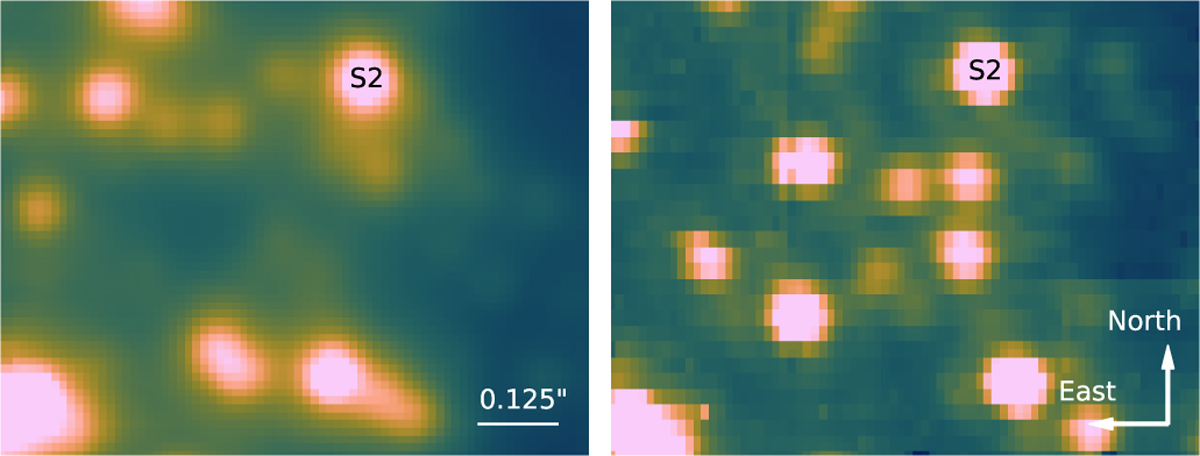
Comparison of S-cluster observations using SINFONI (left) in 2014 and ERIS (right) in 2024. While the left image is the final product of about 50 hours of on-source observations, the right plot was obtained with an integration time of 30 minutes (including overheads). Due to PSF distortions, the left image seems to be smeared. The artifacts in the right image are the result of the insufficient mosaic recipe of ESOREFLEX and the short on-source integration time (Table 5). The images have a spatial pixel scale of 12.5 mas and show the B2V star S2.
Current usage metrics show cumulative count of Article Views (full-text article views including HTML views, PDF and ePub downloads, according to the available data) and Abstracts Views on Vision4Press platform.
Data correspond to usage on the plateform after 2015. The current usage metrics is available 48-96 hours after online publication and is updated daily on week days.
Initial download of the metrics may take a while.