Fig. 10
Download original image
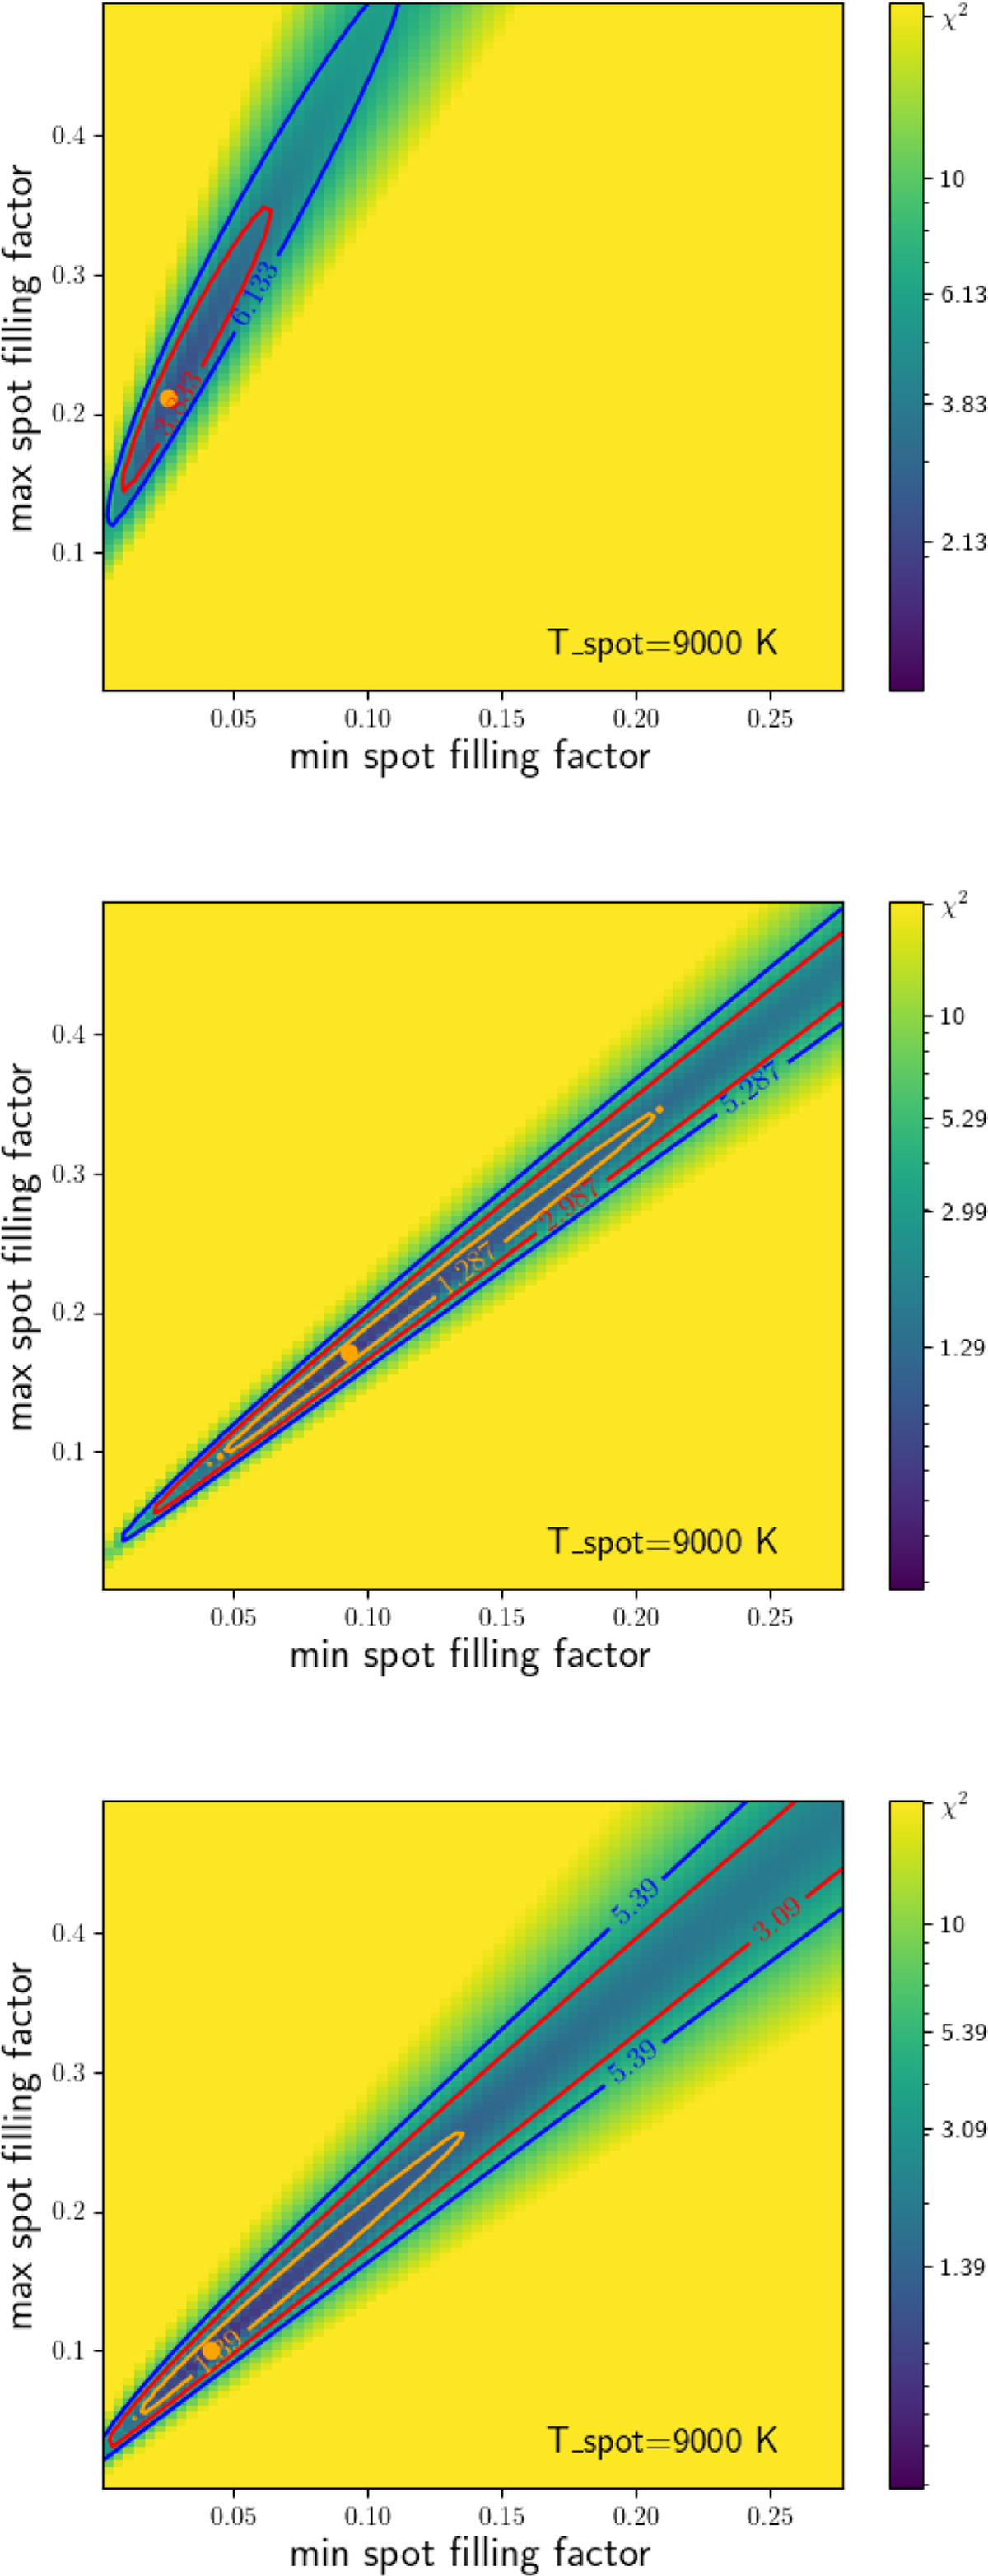
Best-fitting max and min filling factor of the star spot model for the spot temperature set to 9000 K. The orange dots mark the best-fitting model, and the orange, red, and blue contour lines mark the 68%, 90%, and 95% confidence levels. Colours indicate χ2 as shown by the colour bar. Top: amplitude calculated for photometry taken at the date of UVES spectrum no. 1 and X-Shooter spectrum no. 1. Middle: amplitude calculated for the photometry taken at the date of UVES spectrum no. 1 and 2. Bottom: amplitude calculated for the photometry taken at the date of UVES spectrum no. 2 and X-Shooter spectrum no. 1. Intercomparison of the different panels lead to a spot filling factor for the date of UVES spectrum no. 1 of 18–21%, for no. 2 of 10%, and for the date of the X-Shooter spectrum no. 1 of 3–4%.
Current usage metrics show cumulative count of Article Views (full-text article views including HTML views, PDF and ePub downloads, according to the available data) and Abstracts Views on Vision4Press platform.
Data correspond to usage on the plateform after 2015. The current usage metrics is available 48-96 hours after online publication and is updated daily on week days.
Initial download of the metrics may take a while.