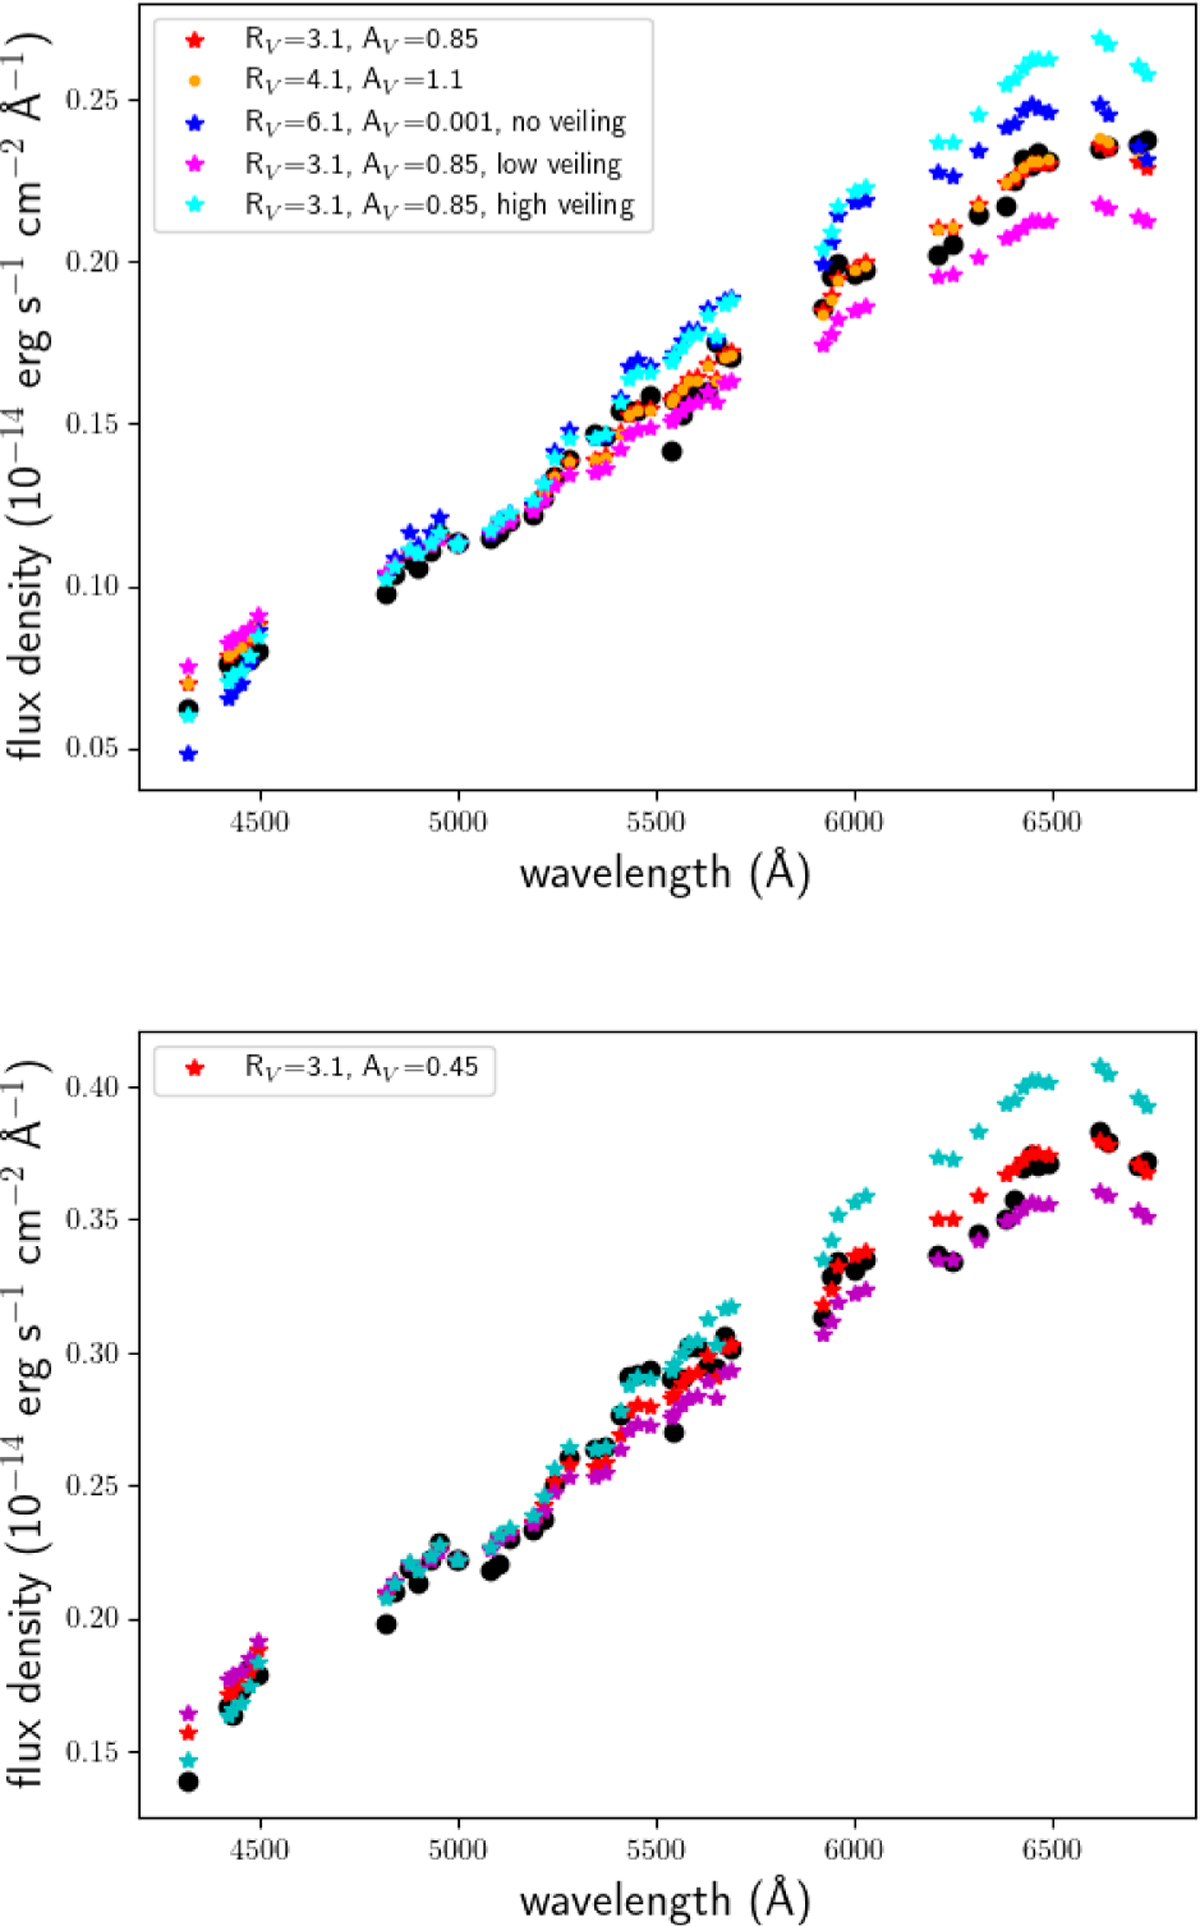
Fig. A.2
Download original image
Same as the bottom of Fig. 5 and Fig. A.1, but for X-Shooter spectra no. 1 (top) and no. 2 (bottom). We also show the continuum flux densities when corrected with the veiling flux plus and minus its standard deviation (magenta and cyan asterisks). For the X-Shooter no. 1 spectrum we show additionally the best extinction fit without a veiling flux applied (blue asterisks) and the best fit with RV deviating from 3.1 as given in the legend. We note that the red asterisks are mainly hidden behind the orange dots.
Current usage metrics show cumulative count of Article Views (full-text article views including HTML views, PDF and ePub downloads, according to the available data) and Abstracts Views on Vision4Press platform.
Data correspond to usage on the plateform after 2015. The current usage metrics is available 48-96 hours after online publication and is updated daily on week days.
Initial download of the metrics may take a while.