Fig. B.3
Download original image
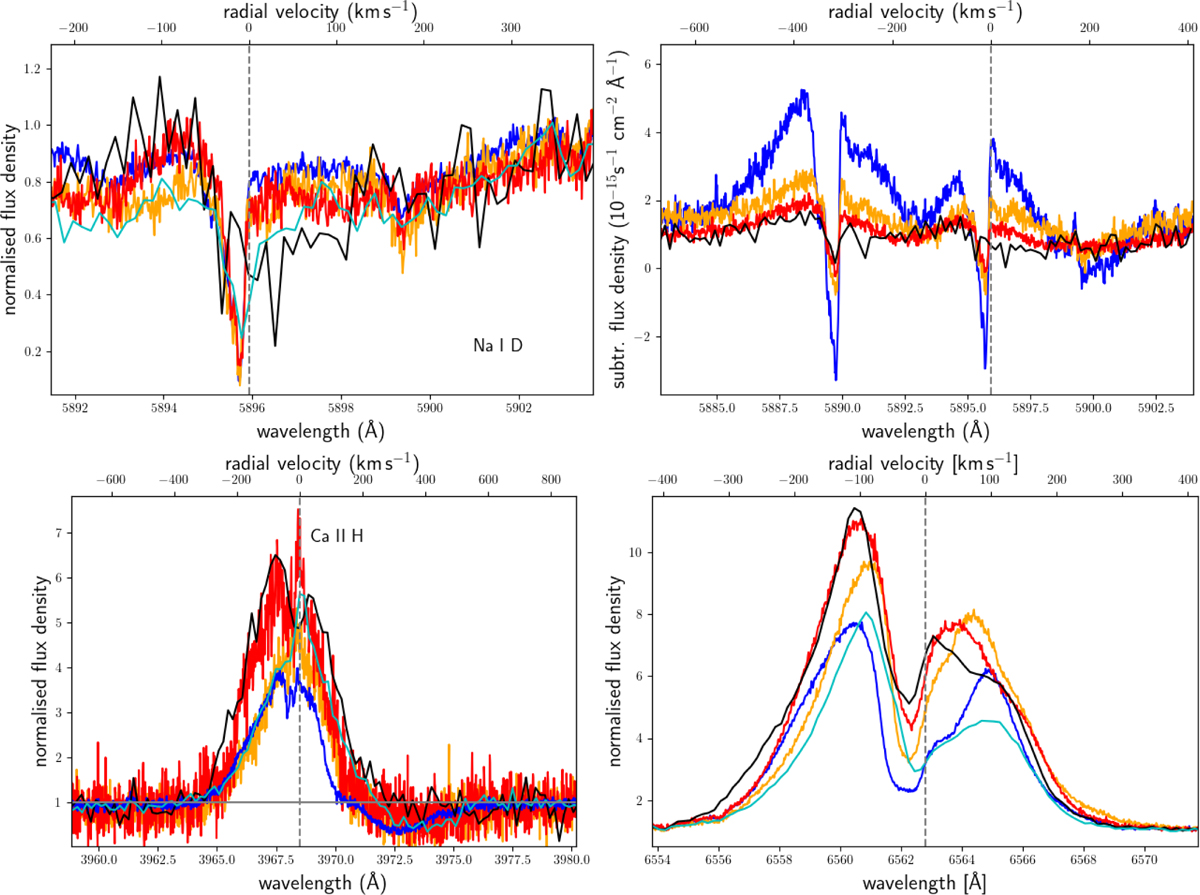
Same as Fig. 9, but for additional emission lines. Top left: Na I D1 line. Top right: Na I D1 and D2 lines with our spectral model from Sect. 8.2 subtracted. We note that the continua of all spectra are in rough agreement with each other, while the correction in this wavelength range is generally underestimated since the continuum is not located at zero. Such local deviations are expected from a broadband model. Colours are as in Fig. 9: Blue denotes the UVES spectrum no. 1 (brightness maximum), orange spectrum no. 2, red spectrum no. 3, and black the X-Shooter spectrum no. 1 (brightness minimum). Since the photospheric spectrum, the continuum veiling, the reddening, and the grey extinction is subtracted, the emission and absorption seen here must originate from the accretion. We note that the broad absorption feature on the red side can only be seen for the Na I D1 line because of the overlap of the two broad lines. We therefore anchored the velocity scale for its central wavelength marked by the vertical dashed line. Bottom left: Ca II H line blended with the Hϵ line. The broad red absorption feature in the blue and the cyan spectrum are from the radial velocity more compatible to originate from the Hϵ line than from the Ca II H line. Bottom right: Hα line.
Current usage metrics show cumulative count of Article Views (full-text article views including HTML views, PDF and ePub downloads, according to the available data) and Abstracts Views on Vision4Press platform.
Data correspond to usage on the plateform after 2015. The current usage metrics is available 48-96 hours after online publication and is updated daily on week days.
Initial download of the metrics may take a while.