Open Access
Fig. 7
Download original image
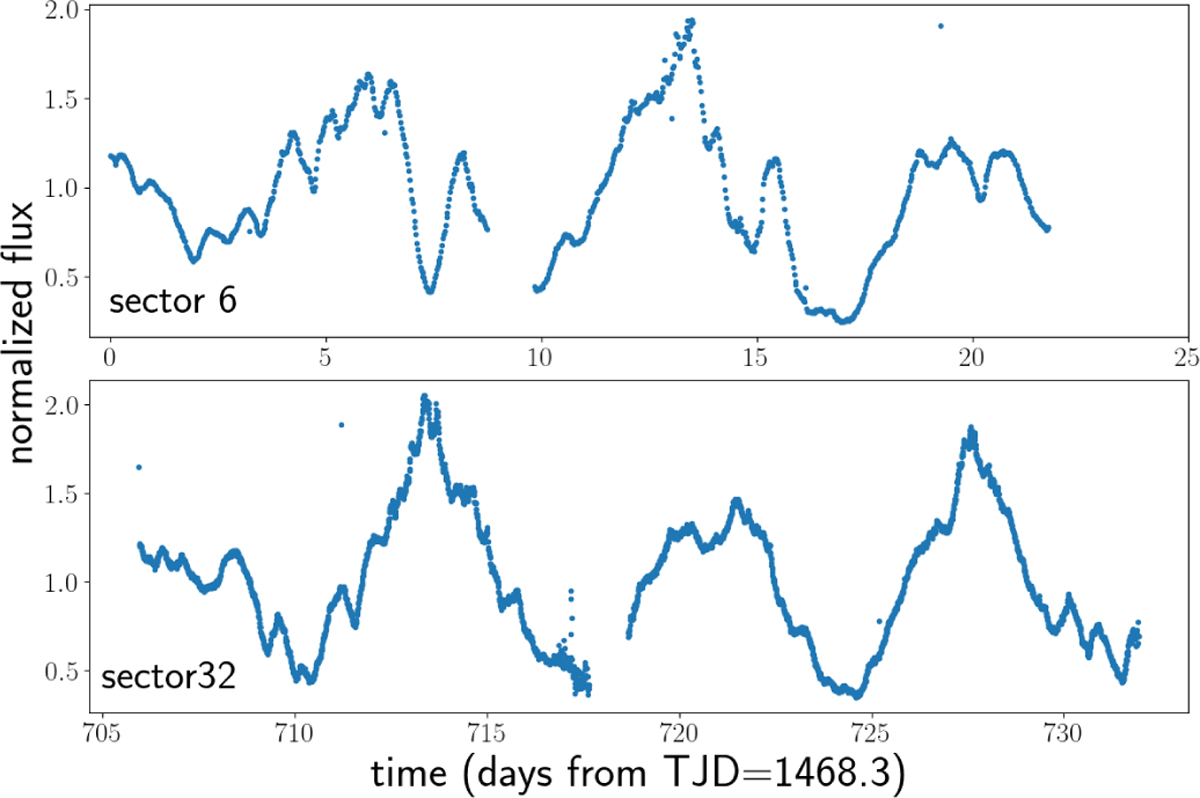
Normalised TESS light curves of V505 Ori in sector 6 and 32. Next to the dominating periodic structure, more details of variability can be seen. For example, in sector 6 there is the additional dip at about day 7, which re-occurs at about day 14.
Current usage metrics show cumulative count of Article Views (full-text article views including HTML views, PDF and ePub downloads, according to the available data) and Abstracts Views on Vision4Press platform.
Data correspond to usage on the plateform after 2015. The current usage metrics is available 48-96 hours after online publication and is updated daily on week days.
Initial download of the metrics may take a while.