Fig. 8
Download original image
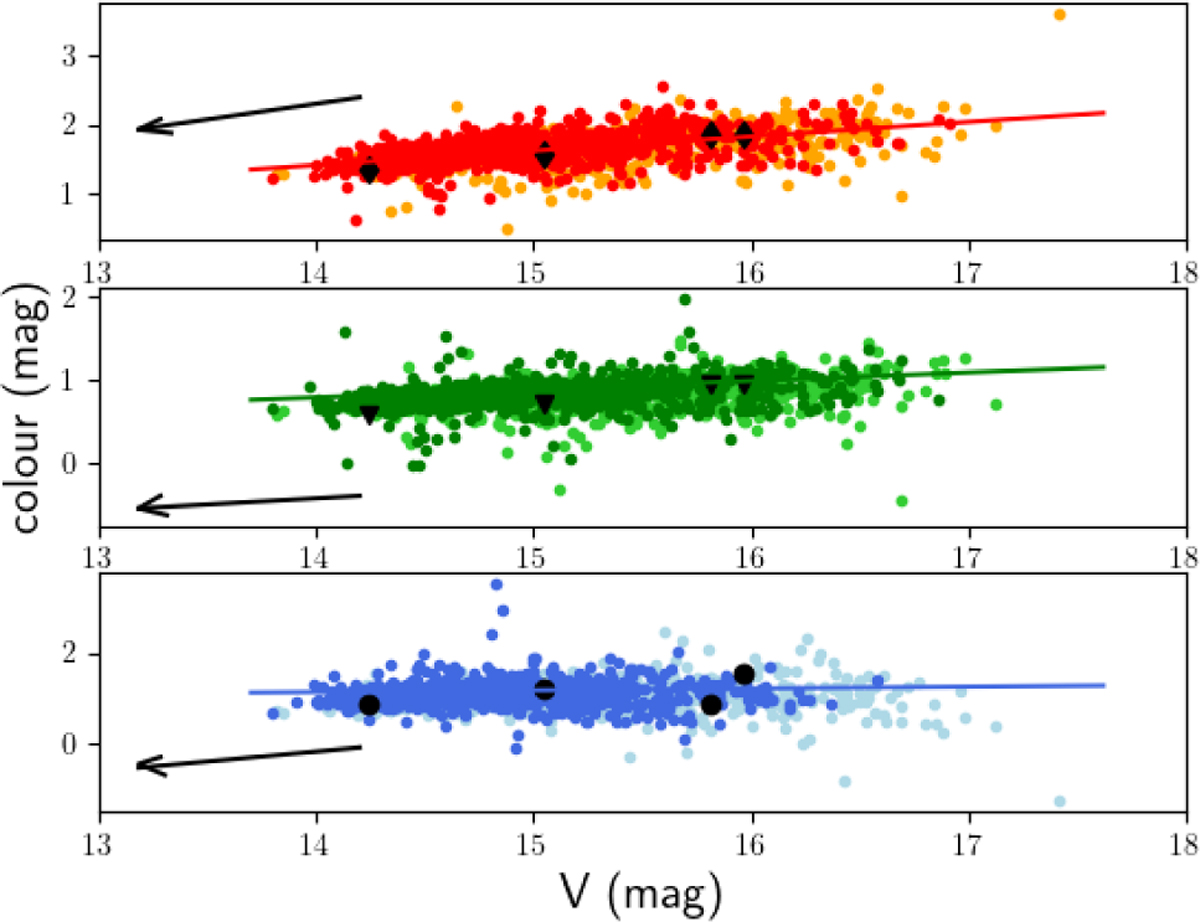
Colour diagram with respect to V band photometry. Red (HOYS) and orange (AAVSO) dots represent V-I, green (HOYS) and light green (AAVSO) dots represent V-R, and blue (HOYS) and light blue (AAVSO) dots represent B-V. The solid coloured lines represent the best linear fit to the data, while the black arrows represent the extinction correction for AV=1.0 mag and RV=3.1. The black symbols denote the mean measurements during the days of the PENELLOPE observations.
Current usage metrics show cumulative count of Article Views (full-text article views including HTML views, PDF and ePub downloads, according to the available data) and Abstracts Views on Vision4Press platform.
Data correspond to usage on the plateform after 2015. The current usage metrics is available 48-96 hours after online publication and is updated daily on week days.
Initial download of the metrics may take a while.