Fig. 9
Download original image
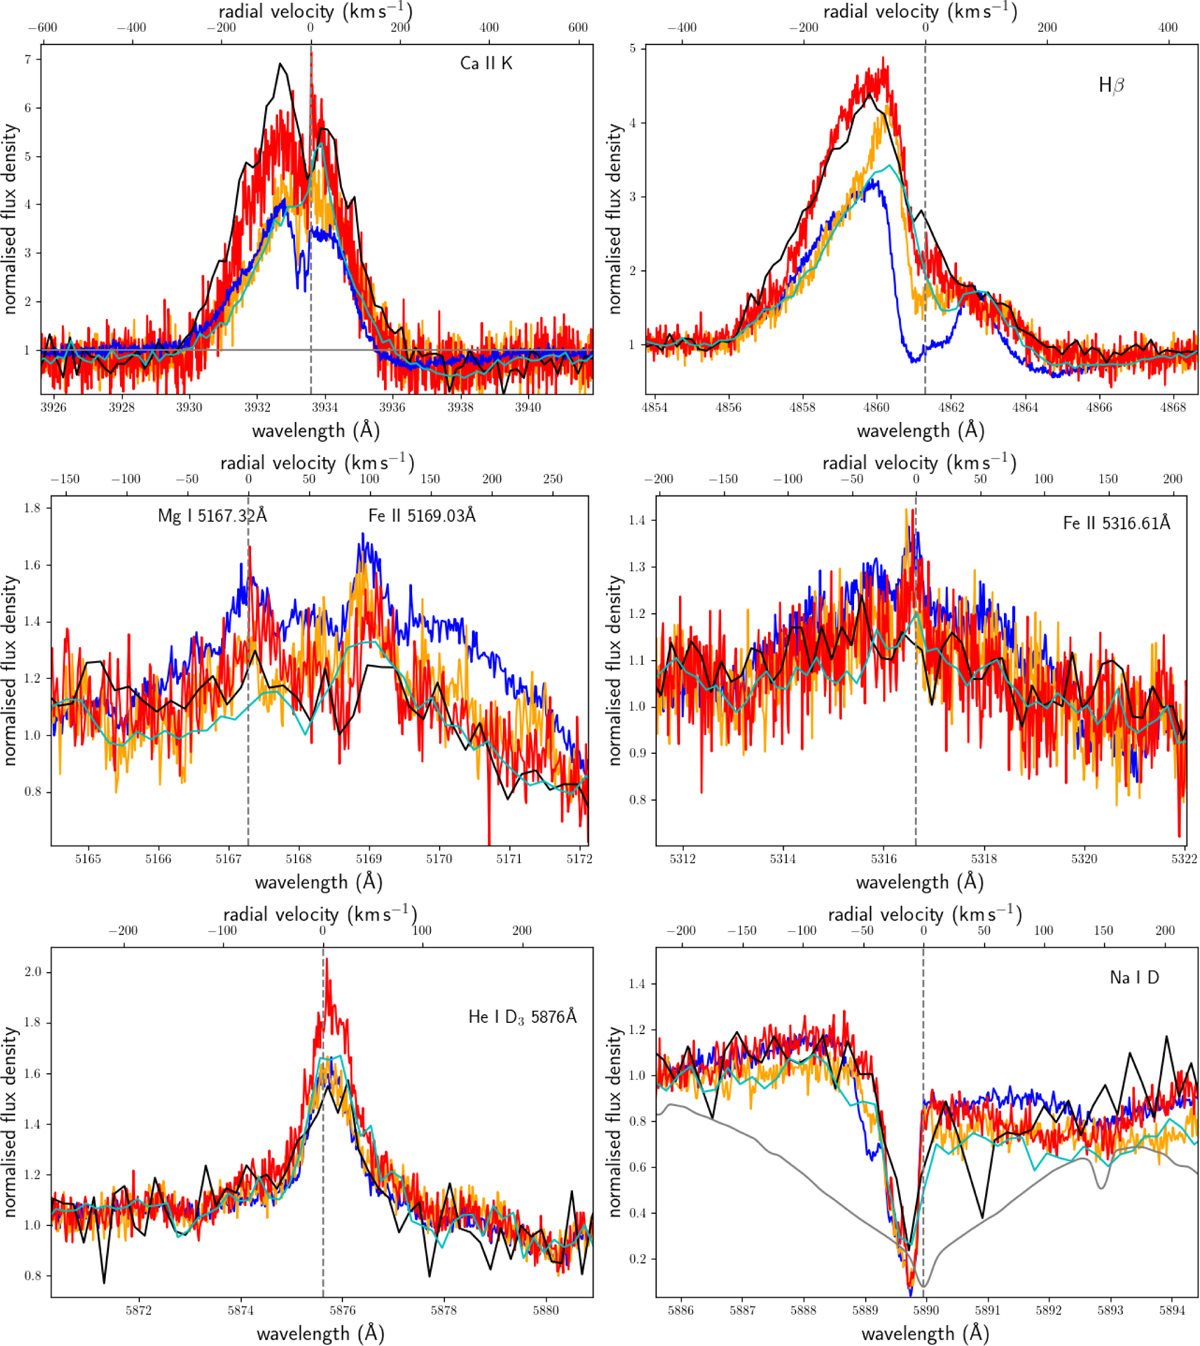
Examples of emission lines in V505 Ori. The UVES no. 1 spectrum is shown in blue, no. 2 in orange, no. 3 in red, X-Shooter spectrum no. 1 in black, and X-Shooter no. 2 in cyan. As a dashed vertical line, we show the central wavelength of the respective line. Top left: Ca II K line. Top right: Hβ line. Middle left: Mg I line at 5167.32 Å. Middle right: Fe II line at 5316.61 Å. Bottom left: He I D3 line. Bottom right: blue Na I D line at 5889.95 Å. In grey we plot a PHOENIX photospheric spectrum with Teff=4400 K.
Current usage metrics show cumulative count of Article Views (full-text article views including HTML views, PDF and ePub downloads, according to the available data) and Abstracts Views on Vision4Press platform.
Data correspond to usage on the plateform after 2015. The current usage metrics is available 48-96 hours after online publication and is updated daily on week days.
Initial download of the metrics may take a while.