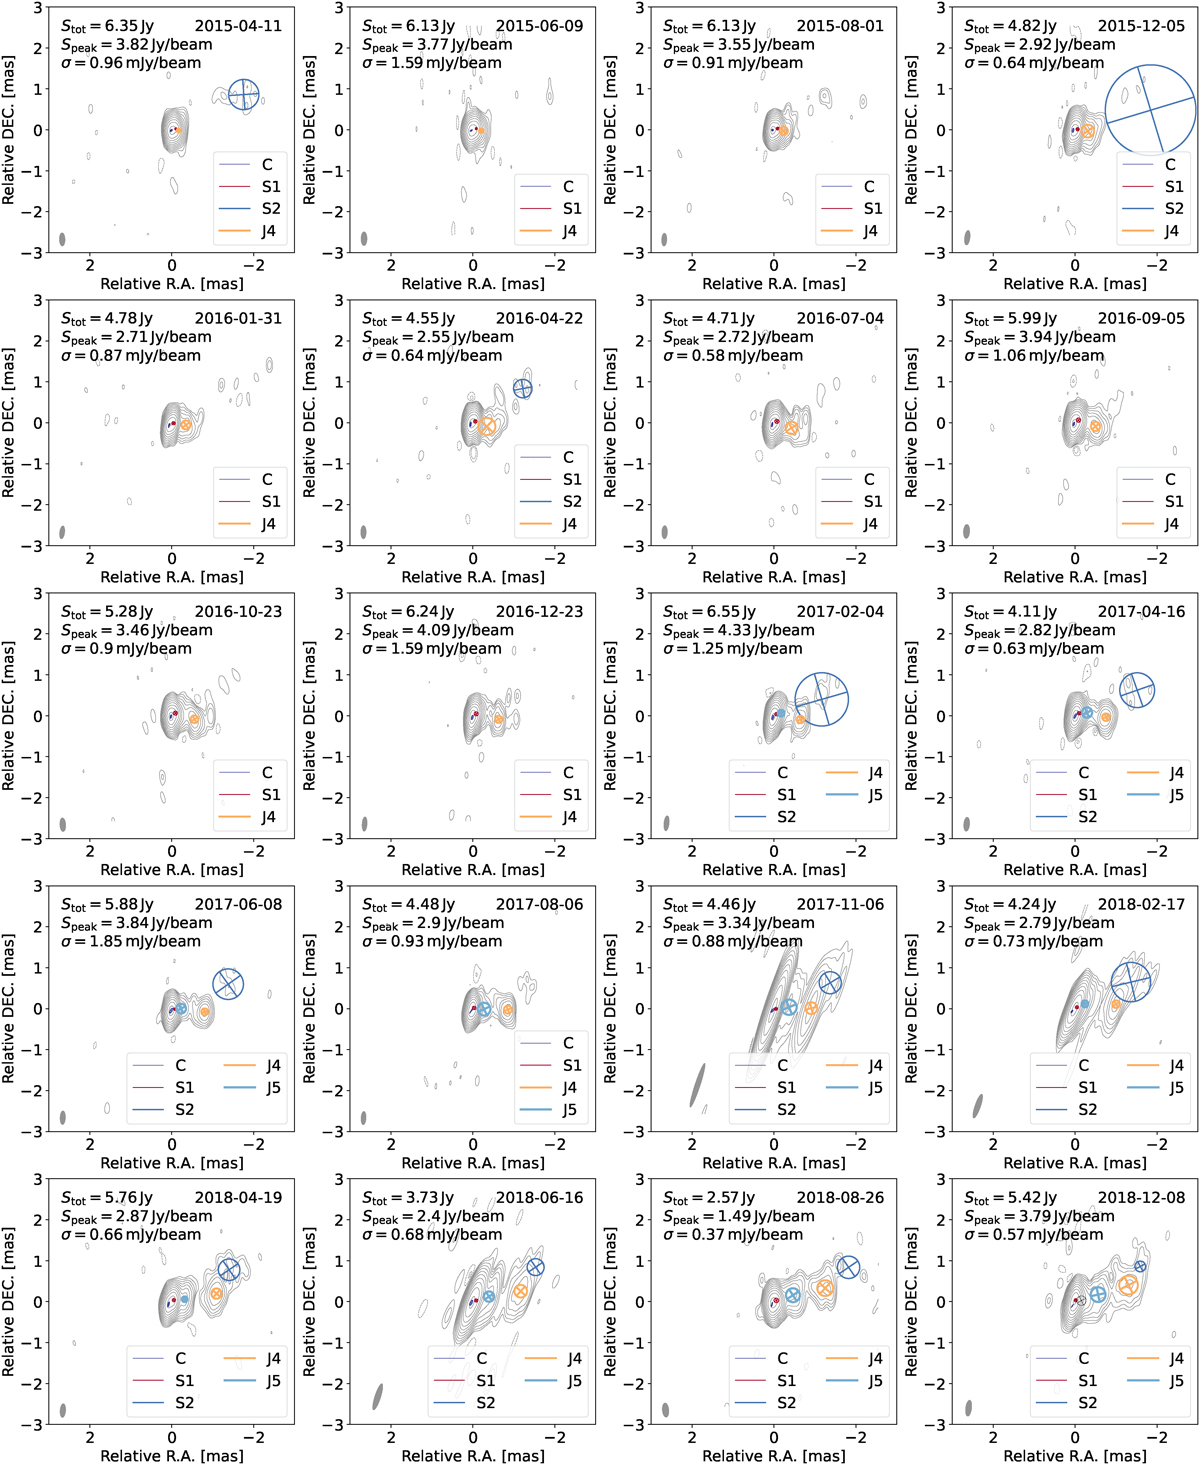
Fig. 1.
Download original image
Selected uniformly weighted 43 GHz VLBA total intensity images of the FSRQ 4C +01.28 with the fitted Gaussian components overlaid. Stot is the total integrated flux density, Speak is the highest flux density per beam, and σ is the noise level. The gray ellipse in the bottom left corner corresponds to the beam. The contours begin at 3σ and increase logarithmically by a factor of 2. The image parameters are listed in Table C.1. The images show two newly ejected jet components appearing in August 2015 (J4) and June 2018 (J5) that can be tracked back until April 2015 and February 2017, respectively. In this work we focus on these two newly ejected components. Additional plots of the epochs observed before April 2015 are shown in Appendix B in Figs. B.1–B.2.
Current usage metrics show cumulative count of Article Views (full-text article views including HTML views, PDF and ePub downloads, according to the available data) and Abstracts Views on Vision4Press platform.
Data correspond to usage on the plateform after 2015. The current usage metrics is available 48-96 hours after online publication and is updated daily on week days.
Initial download of the metrics may take a while.