Fig. 2.
Download original image
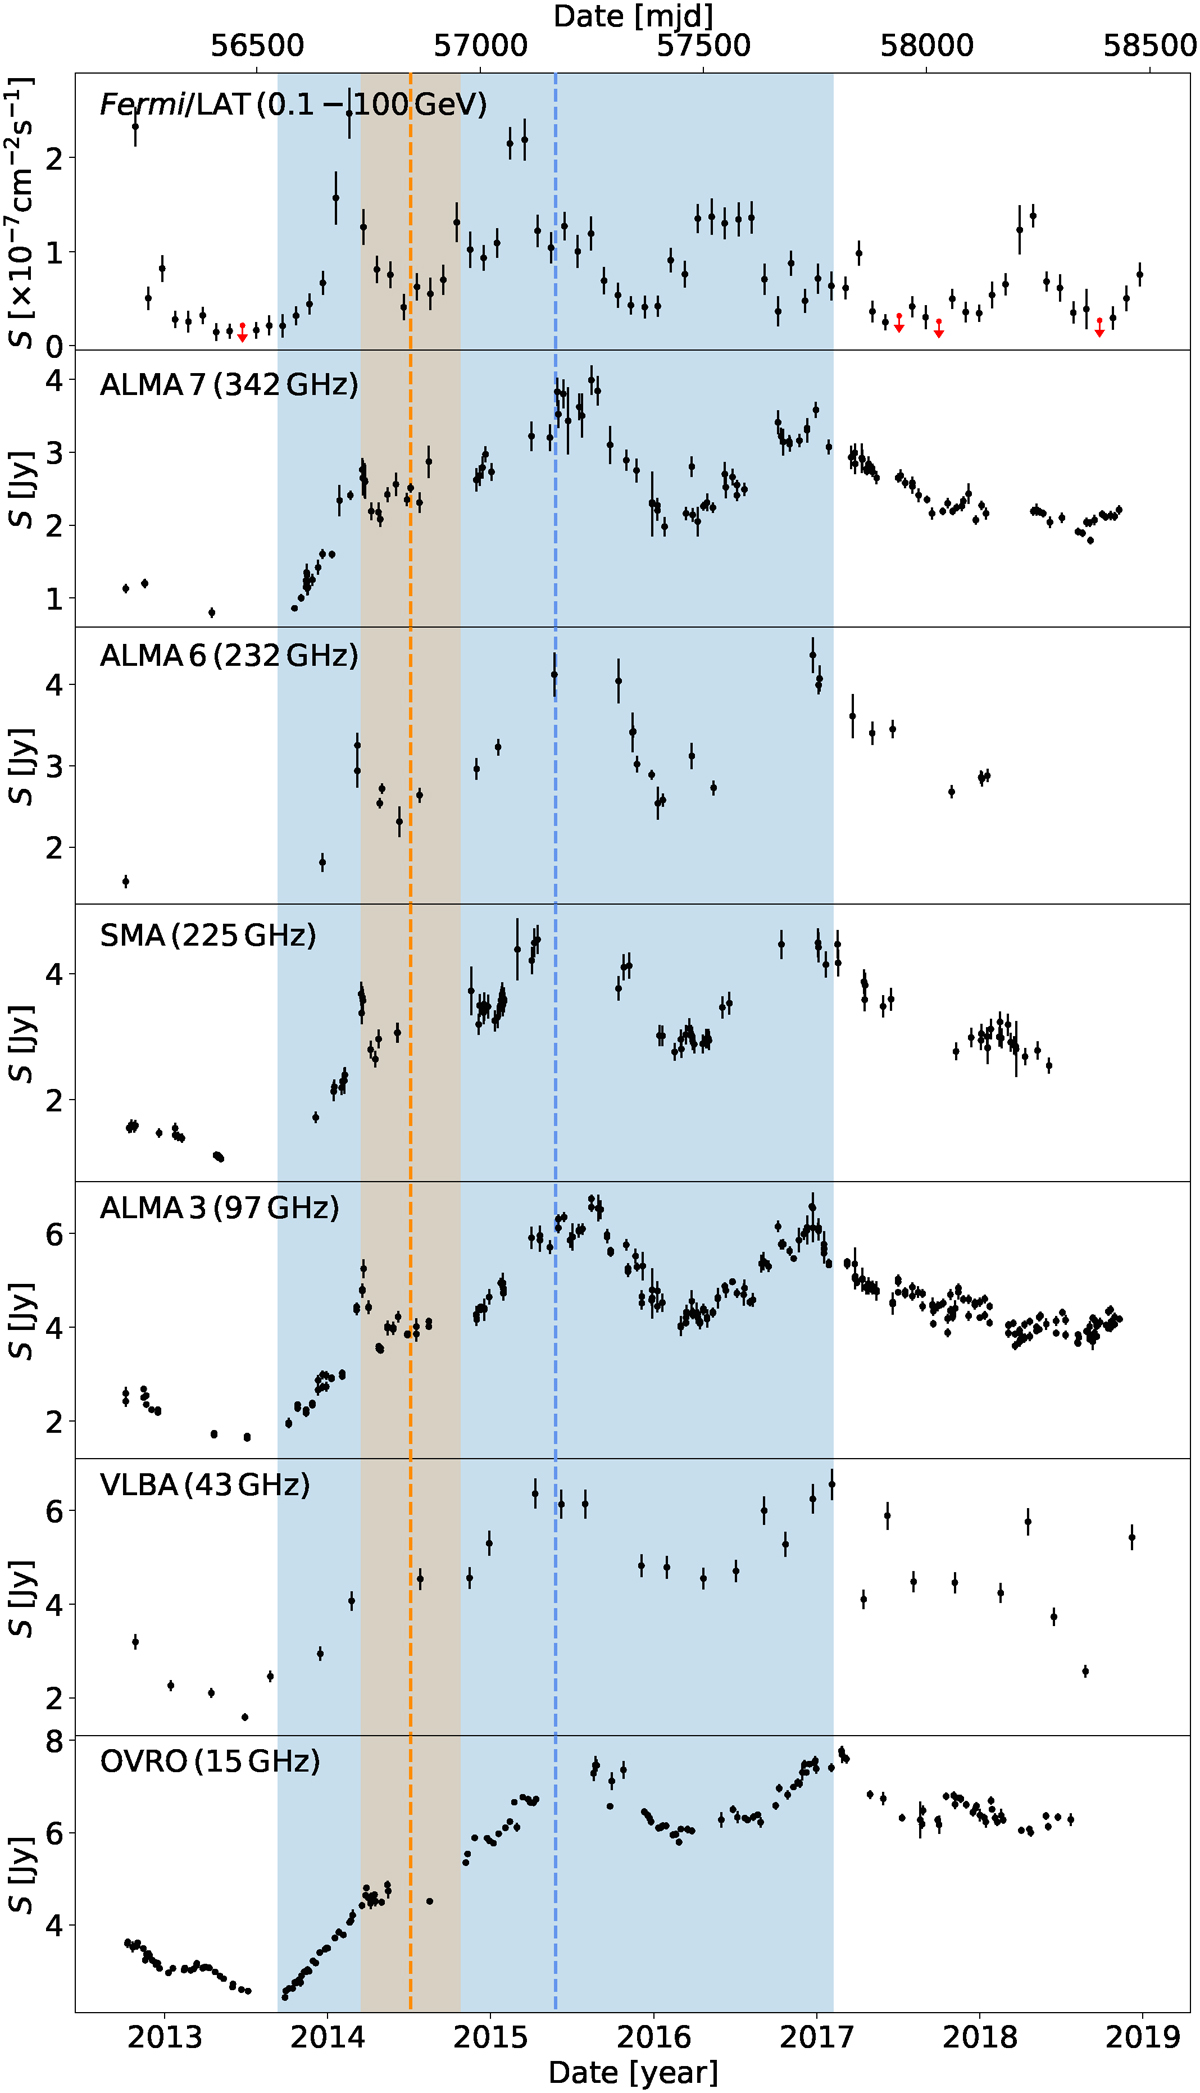
Monthly binned γ-ray and radio light curves observed by Fermi/LAT, ALMA, SMA, and OVRO and the VLBA total flux density light curve, showing similar variability behavior. In the upper panel red arrows indicate upper limits. The vertical dashed lines represent the ejection epochs of the jet components J4 (orange) and J5 (blue) with their 1σ uncertainties shown as the orange (J4) and blue (J5) bands. The ejection of the components J4 and J5 falls into the period of high activity starting in late 2013.
Current usage metrics show cumulative count of Article Views (full-text article views including HTML views, PDF and ePub downloads, according to the available data) and Abstracts Views on Vision4Press platform.
Data correspond to usage on the plateform after 2015. The current usage metrics is available 48-96 hours after online publication and is updated daily on week days.
Initial download of the metrics may take a while.