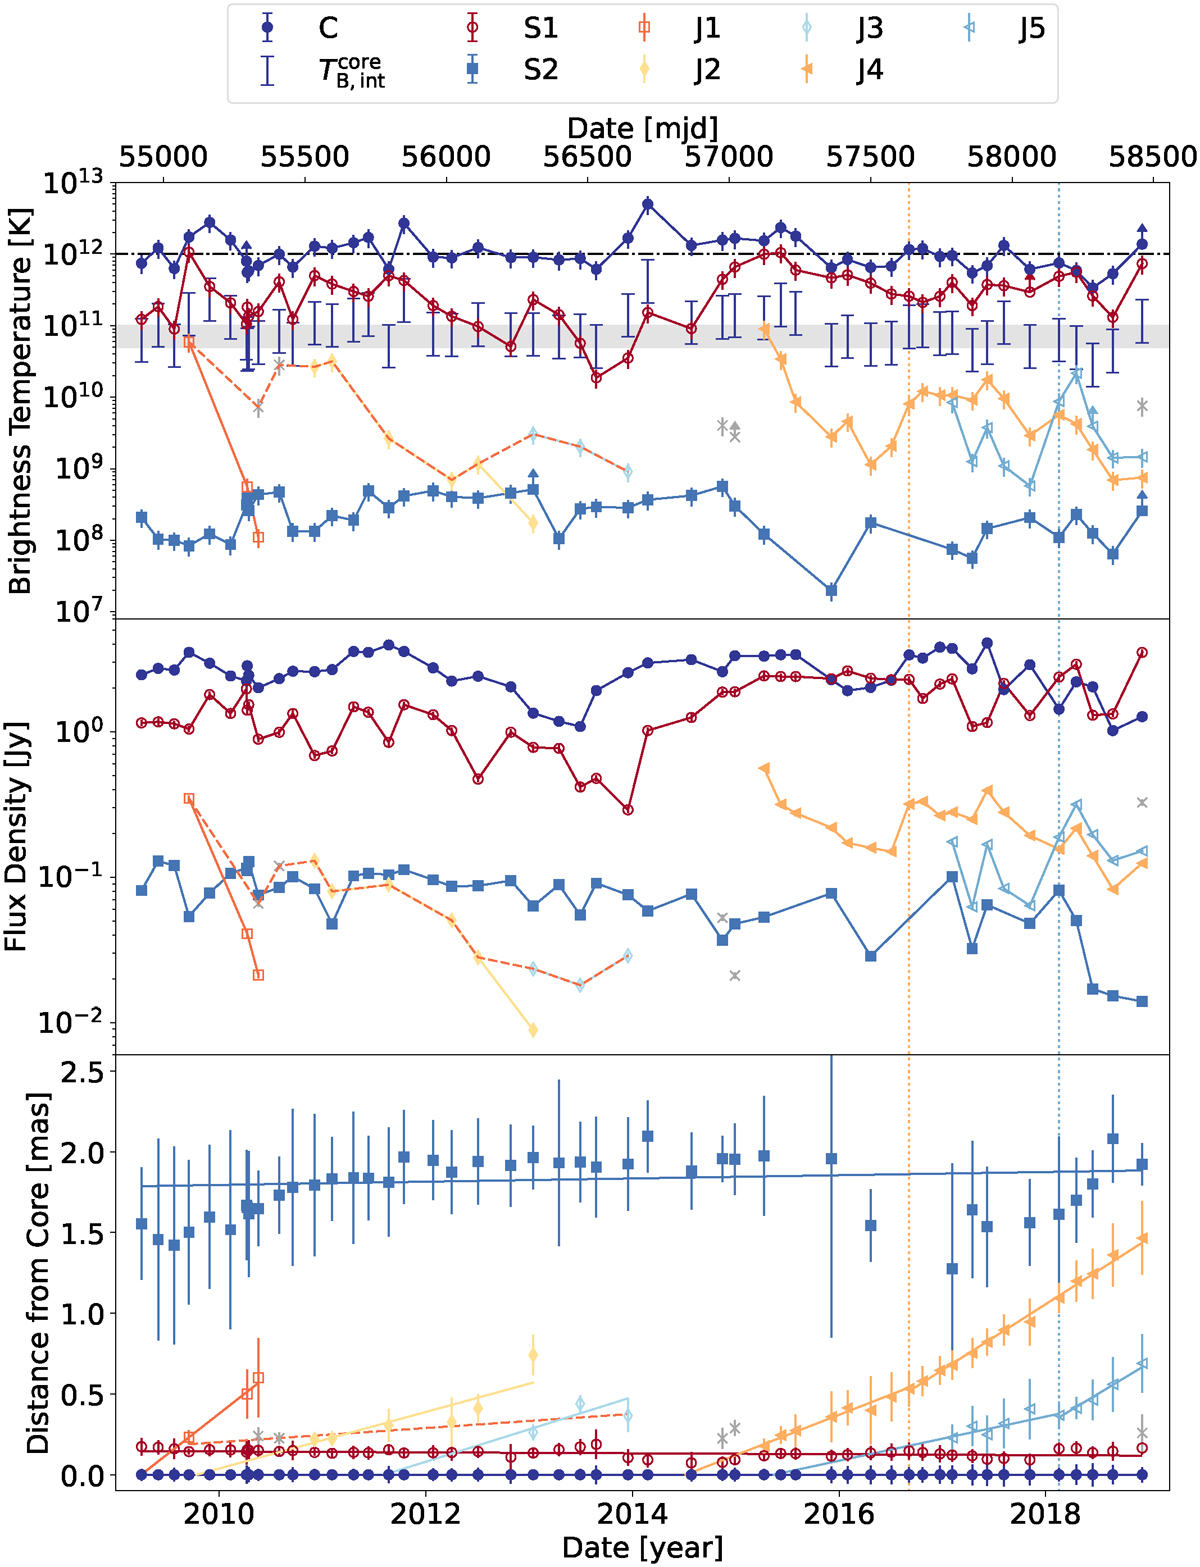
Fig. 3.
Download original image
Upper panel: observed brightness temperatures of the jet components with relative uncertainties of 29% plotted over time. The arrows denote lower limits for unresolved components. The horizontal dashed-dotted line represents the inverse Compton limit of 1012 K. The gray-shaded area denotes the range of brightness-temperature values for a jet in equipartition. The intrinsic brightness temperature of the core (blue bars) is mostly consistent with equipartition and lies only above equipartition close to the ejection epochs of moving jet components. Middle panel: flux densities of the jet components with relative uncertainties of 5% plotted over time. Lower panel: distance of the jet components relative to the core component plotted over time. The solid lines are fitted via linear regression and their gradients represent the angular speed of the corresponding component. The dashed fitted line represents an alternative kinematics model for the components J1, J2, and J3 (see Sect. 3.1.1). Components J4 and J5 seem to accelerate and are therefore fitted by two separated linear regressions each with their transition points indicated by the two vertical dotted lines. At these transition points their brightness temperatures and flux densities show a steep increase.
Current usage metrics show cumulative count of Article Views (full-text article views including HTML views, PDF and ePub downloads, according to the available data) and Abstracts Views on Vision4Press platform.
Data correspond to usage on the plateform after 2015. The current usage metrics is available 48-96 hours after online publication and is updated daily on week days.
Initial download of the metrics may take a while.