Fig. 6.
Download original image
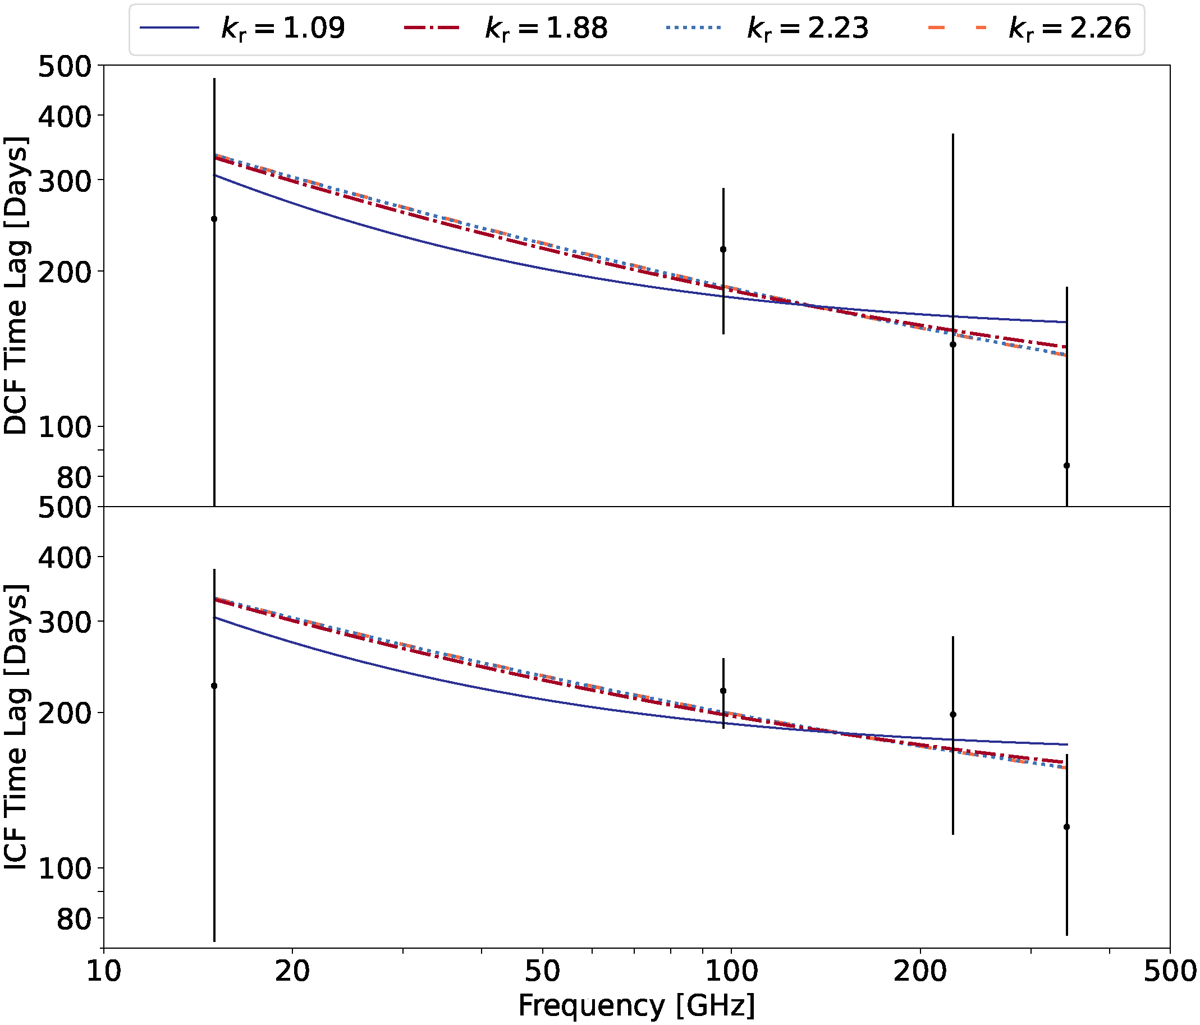
Time lags τγ, ν derived from the DCF (upper panel) and the ICF (lower panel) plotted as a function of frequency ν. Positive time lags mean that the radio light curve follows the Fermi/LAT γ-ray light curve. To investigate the core shift, the time lags are fitted by ![]() , where τγ is the time a newly ejected component needs to travel from the jet base to the γ-ray emitting region at speed μ and C is a constant. Using the calculated power law index kr = 1.09, the best fits (solid dark blue lines) result in the de-projected location of the γ-ray emitting region of
, where τγ is the time a newly ejected component needs to travel from the jet base to the γ-ray emitting region at speed μ and C is a constant. Using the calculated power law index kr = 1.09, the best fits (solid dark blue lines) result in the de-projected location of the γ-ray emitting region of ![]() . For greater kr the lower limit of the γ-ray region would shift upstream in the jet to dγ, min ≤ 1 pc for kr ≥ 1.88 (dashed-dotted red lines), dγ, min ≤ 0.1 pc for kr ≥ 2.23 (dotted light blue lines), and dγ, min ≤ 0.01 pc for kr ≥ 2.26 (dashed orange lines).
. For greater kr the lower limit of the γ-ray region would shift upstream in the jet to dγ, min ≤ 1 pc for kr ≥ 1.88 (dashed-dotted red lines), dγ, min ≤ 0.1 pc for kr ≥ 2.23 (dotted light blue lines), and dγ, min ≤ 0.01 pc for kr ≥ 2.26 (dashed orange lines).
Current usage metrics show cumulative count of Article Views (full-text article views including HTML views, PDF and ePub downloads, according to the available data) and Abstracts Views on Vision4Press platform.
Data correspond to usage on the plateform after 2015. The current usage metrics is available 48-96 hours after online publication and is updated daily on week days.
Initial download of the metrics may take a while.