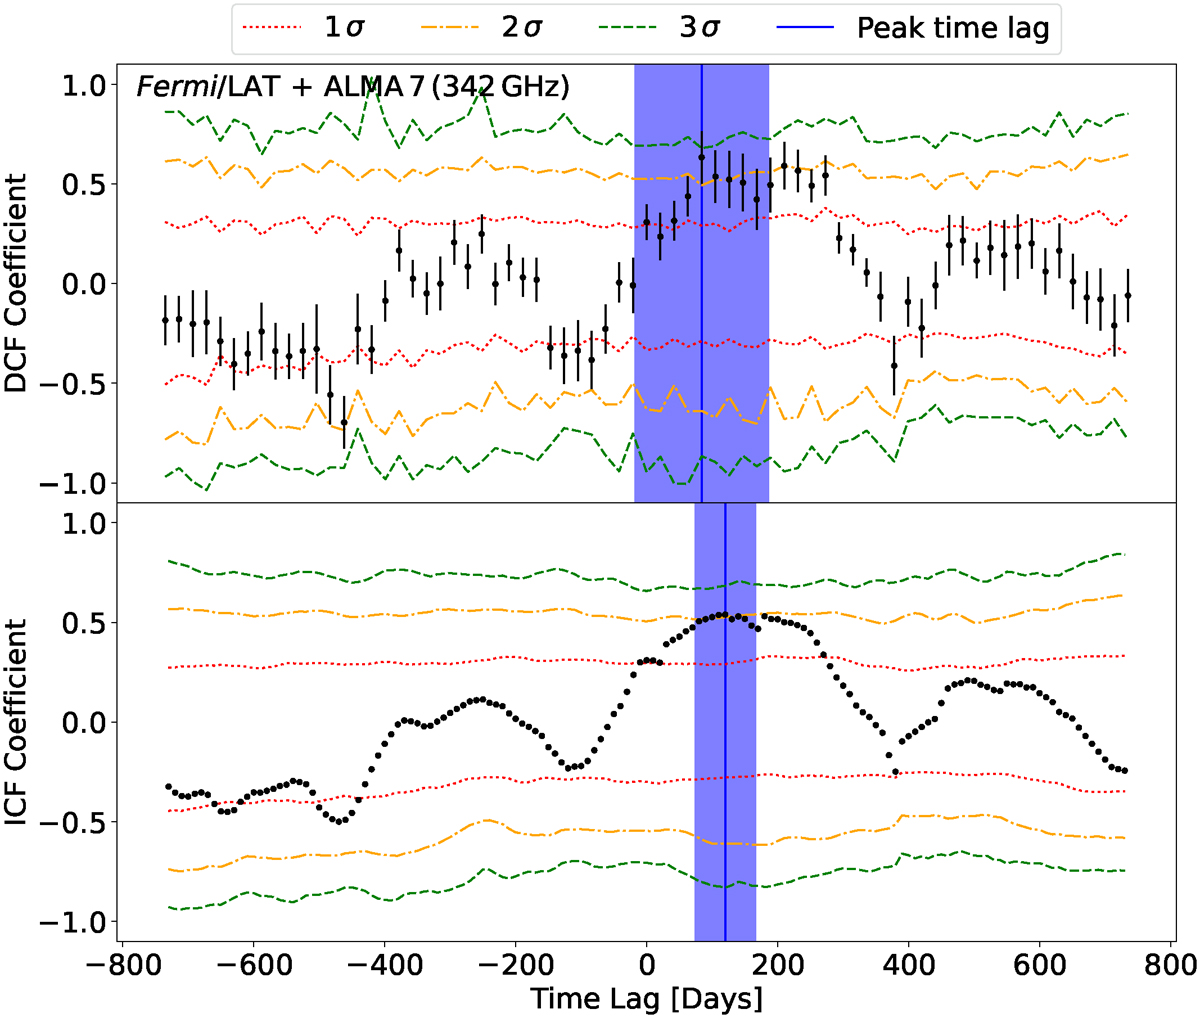
Fig. A.1.
Download original image
DCF (upper panel) and ICF (lower panel) cross-correlation coefficients between the Fermi/LAT γ-ray and ALMA 7 light curves plotted over time lag. For the DCF the bin size is chosen to be 21 days, while the interpolation unit for the ICF is chosen to be 10 days (both calculated as explained in Sect. 2.4.1). Positive time lags mean that the radio light curve follows the Fermi/LAT γ-ray light curve. The time lags for the peak cross-correlation coefficients are marked by solid blue lines, with their 1σ uncertainties given by the shaded blue area. The dotted red, dashed-dotted orange, and dashed green lines correspond to the two sided Gaussian equivalent 1σ, 2σ, and 3σ confidence intervals.
Current usage metrics show cumulative count of Article Views (full-text article views including HTML views, PDF and ePub downloads, according to the available data) and Abstracts Views on Vision4Press platform.
Data correspond to usage on the plateform after 2015. The current usage metrics is available 48-96 hours after online publication and is updated daily on week days.
Initial download of the metrics may take a while.