Fig. 10
Download original image
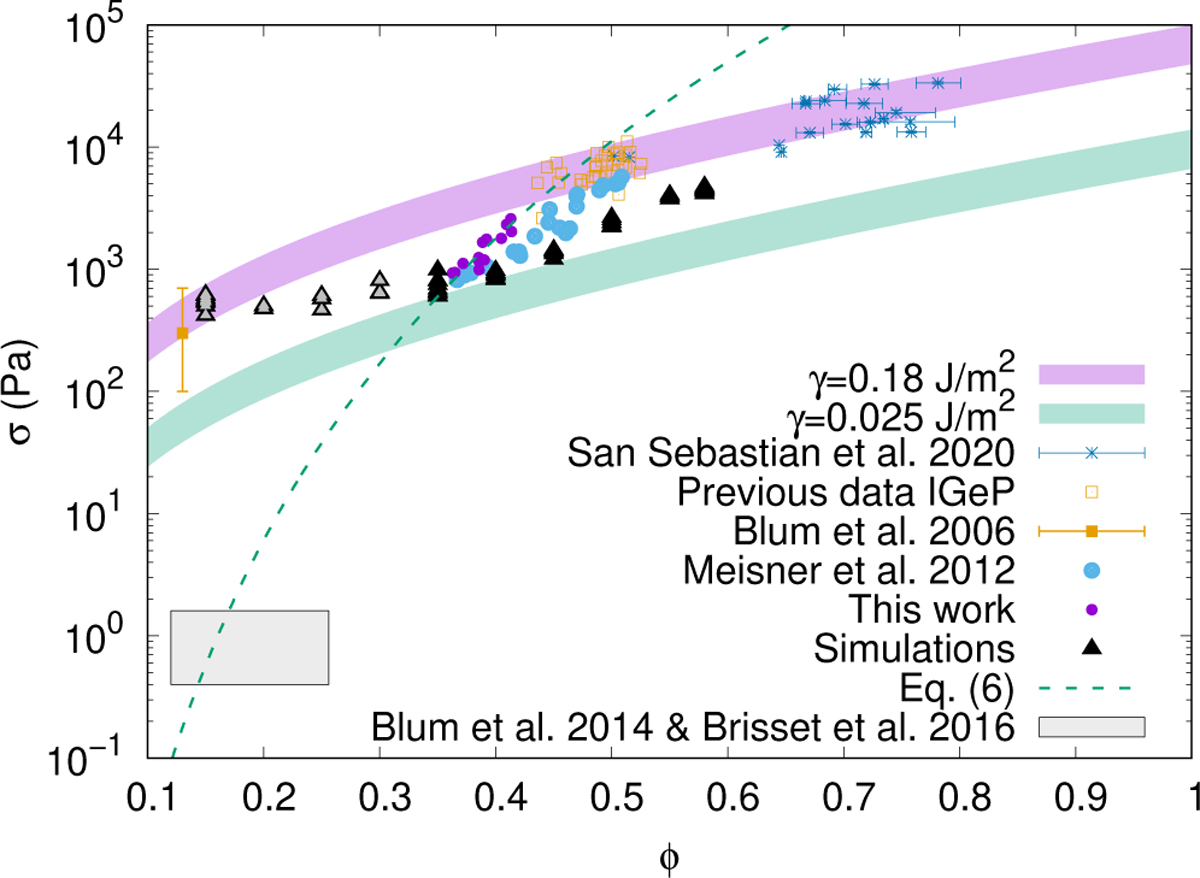
Dependence of the tensile strength of packings of microgranular silica grains on the VFF. A comparison of the data obtained in this study (‘This work’) with measurements from San Sebastián et al. (2020) (grain-size range: 0.5 μm to 10 μm); hand-compressed samples ‘Previous data IGeP’ (grain-size range: 0.5 μm to 10 μm); Meisner et al. (2012) (grain-size range: 0.1 μm to 10 μm); and Blum et al. (2006) (grain-size range: 0.05 μm to 5 μm) is shown. The purple and light blue areas indicate the relation between the tensile strength and VFF obtained by Kimura et al. (2020, their Equation (5)) for γ=0.18 J/m2 and γ=0.025 J/m2, respectively. The widths of the two coloured curves mark the range of possible grain radii in the samples between 0.63 μm (upper limits of the two curves) and 2.05 μm (lower limits of the two curves). For comparison, our numerical simulations (rescaled to a monomer size of 0.76 μm) are shown as black triangles for φ>0.3, while the grey triangles indicate unreliable results for φ ≤ 0.3. The grey box stems from the data of Blum et al. (2014) and Brisset et al. (2016), corresponding to pebble-piles and/or aggregates.
Current usage metrics show cumulative count of Article Views (full-text article views including HTML views, PDF and ePub downloads, according to the available data) and Abstracts Views on Vision4Press platform.
Data correspond to usage on the plateform after 2015. The current usage metrics is available 48-96 hours after online publication and is updated daily on week days.
Initial download of the metrics may take a while.