| Issue |
A&A
Volume 704, December 2025
|
|
|---|---|---|
| Article Number | A206 | |
| Number of page(s) | 8 | |
| Section | Planets, planetary systems, and small bodies | |
| DOI | https://doi.org/10.1051/0004-6361/202556254 | |
| Published online | 16 December 2025 | |
Compressibility and strength of pebble piles
1
Department of Aerospace Science and Technology, Politecnico di Milano,
Via La Masa 34,
Milano 20156,
Italy
2
Instituto de Astrofísica de La Plata,
CCT La Plata-CONICET-UNLP, Paseo del Bosque S/N (1900),
La Plata,
Argentina
3
Institute of Geophysics and Extraterrestrial Physics (IGEP), Technische Universität Braunschweig,
Mendelssohnstraße 3,
38106
Braunschweig,
Germany
4
Space Research & Planetary Sciences, Physics Institute, University of Bern,
Gesellschaftsstrasse 6,
Bern 3012,
Switzerland
★ Corresponding author: This email address is being protected from spambots. You need JavaScript enabled to view it.
Received:
4
July
2025
Accepted:
7
October
2025
Abstract
Context. Pebbles play a crucial role in planetary and planetesimal formation, as planetesimals and their remnants form from the gravitational collapse of a pebble cloud. Understanding the compressibility and strength of pebble piles is essential not only for elucidating these processes, but also for collisional evolution studies.
Aims. We aim to characterise the compressibility and tensile strength of pebble-pile samples under static compression.
Methods. We generated different-sized silica pebbles in the laboratory to assemble pebble-pile samples. The samples were compressed to derive their crush curves, then determine the tensile strength of the compressed samples using the Brazilian disk test. Additionally, we calculated the tensile strength through discrete element method simulations (DEM) and compared the results with our experimental findings.
Results. We obtain a new empirical relation linking tensile strength with the volume filling factor, consistent with previous results at low pressures but extended to higher compaction levels. Our findings show that tensile strength is independent of pebble size within the tested range. We also establish a new relationship for tensile strength as a function of pressure in pebble piles, which provides a better fit at higher pressures than previous approximations. The DEM simulations reproduce experimental results with good agreement.
Conclusions. The tensile strength of pebble piles, at moderate to high compaction, converges with those of dust aggregates, indicating partial or complete disintegration of the pebbles. Our results provide physically consistent scaling laws that describe relationships between pressure, porosity, and tensile strength.
Key words: methods: laboratory: solid state / methods: numerical / planets and satellites: formation
© The Authors 2025
 Open Access article, published by EDP Sciences, under the terms of the Creative Commons Attribution License (https://creativecommons.org/licenses/by/4.0), which permits unrestricted use, distribution, and reproduction in any medium, provided the original work is properly cited.
This article is published in open access under the Subscribe to Open model. This email address is being protected from spambots. You need JavaScript enabled to view it. to support open access publication.
1 Introduction
Pebble piles, aggregates of millimetre- to centimetre-size consisting of microscopic dust or ice grains, have become increasingly relevant in studies of early-stage planetary formation. Planetesimals and their remnants in the modern Solar System formed from the gentle gravitational collapse of a pebble cloud (e.g. Blum et al. 2017, 2022; Bürger et al. 2023). The study of their compressibility and tensile strength provides insights into their mechanical behaviour, particularly in response to impacts and gravitational forces, which is critical for modelling small-body impacts and dynamics (e.g. Jutzi et al. 2017; Raducan et al. 2024).
Porosity is a crucial factor in understanding the outcome of collisions in small bodies of the Solar System. Measurements of the meteorite porosity (Macke et al. 2010, 2011) and calculated porosities of asteroids, Kuiper Belt objects, and comets (Baer et al. 2011; Malamud & Prialnik 2015; Groussin et al. 2019) indicate that these objects possess a wide range of porosities. The crush curve for porous materials, in some studies referred to as the equation of state, describes the change in porosity ψ, or volume filling factor (VFF), φ=1−ψ, as a function of pressure. The compaction of porous material and the resulting change in its tensile strength are essential aspects to consider during collisions.
Crush curves can be obtained through dynamic or static compression in laboratory experiments. For instance, Beitz et al. (2013) and San Sebastián et al. (2020) performed high-speed impact experiments to dynamically compress silica samples. Several studies have investigated static compression using various silica powders across different pressure ranges (e.g. Güttler et al. 2009; Yasui & Arakawa 2009; Meisner et al. 2012). Malamud et al. (2022) performed compression experiments on hierarchical samples of pebble aggregates instead of using homogeneous samples, where each pebble is a porous aggregate composed of micron-sized silica grains. Malamud et al. (2024) performed static omnidirectional compression experiments with a hydraulic press, using different silica powders composed of either spherical or angular grains, and, by combining these results and all the previous laboratory results, obtained a new crush curve by fitting the empirical results for micro-granular silica experiments. The implementation of these relationships in collision codes results in significant variations depending on the adopted crush curve prescription (e.g. Luther et al. 2022; Malamud et al. 2024).
In addition to compressibility, tensile strength provides information about the structural stability against the disruption of granular bodies, particularly under conditions of gravitational collapse or external stresses, such as impacts. Diverse empirical estimations of the tensile strength have been explored in the literature. Blum et al. (2006) estimated the tensile strength of loosely packed dust aggregates, employing a technique wherein high-porosity dust samples were bonded to glass substrates and gradually separated to measure fracture forces. Applying the Brazilian disk test (BDT), Meisner et al. (2012) analysed polydisperse SiO2 dust aggregates across varying VFFs, revealing that the tensile strength increases towards higher filling factors. San Sebastián et al. (2020) expanded this research for highly compact samples and obtained, using previous empirical estimations of the tensile strength, a relation between the tensile strength and the VFF over a wide range of these parameters. Recent studies, such as Kreuzig et al. (2024), derived the tensile strength of desiccated silica-ice samples using a standardised BDT in a vacuum chamber, while Capelo et al. (2024) estimated the tensile strength of granular samples mimicking planetesimal dust regoliths by calculating pressure gradients through parabolic flights.
The discrete element method (DEM) is often utilised to model complex granular systems, enriching our understanding derived from theoretical, experimental, and observational data. Numerical simulations are especially effective for investigating the regolith-covered surfaces of asteroids, comets, and small moons, i.e. small-body granular environments (e.g. Schwartz et al. 2012; Sunday et al. 2020; Zhang et al. 2021; Wimarsson et al. 2024). To better understand the physics and structural properties of these planetary bodies, the ability to simulate objects with a wide range of porosities (see e.g. the methods detailed in Klar et al. 2024) is key for comparing with laboratory experiments.
In this work, we study the compressibility and strength of pebble-piles, expanding on the knowledge from previous research on these aggregates. In that sense, we produced silica pebble-pile samples with different pebble sizes and a range of porosities and determined their crush curves and tensile strengths through laboratory experiments designed for this purpose. To complement and contrast the experimental results, we also calculated the tensile strength using DEM simulations (Kelly et al. 2020; Klar et al. 2024). The paper layout is structured as follows. In Section 2, we present the pebble-pile laboratory experiments. In Section 2.1, we present the pebble-pile compression experiments and their results, and in Section 2.2 we present the BDT applied to the compressed samples and the obtained values of their tensile strength. In Section 3, we describe our DEM simulations. In Section 4, we discuss and compare the experimental and simulation results. Finally, in Section 5 we summarise and conclude our work.
2 Pebble-pile laboratory experiments
Following Malamud et al. (2022), we conducted compression experiments to produce compact agglomerates made from different pebble sizes. Following the compression, we performed the BDT of these samples in order to obtain the values of their tensile strengths. In the next subsections, we describe the setups and methods developed for these experiments along with the results obtained.
We used as approximations power-law functions between VFF φ, compressive stress (or pressure) P, and tensile strength σ in the following way:
 (1)
(1)
 (2)
(2)
 (3)
with the parameters a, a′, a′′, b, b′, b′′ assumed as constant values.
(3)
with the parameters a, a′, a′′, b, b′, b′′ assumed as constant values.
 |
Fig. 1 Examples of SiO2 pebbles with diameters between 1.6 mm and 2.5 mm produced in the laboratory. |
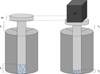 |
Fig. 2 Schematic sketch of the compression experiment showing the hollow cylinder with the pebbles inside and the stamp above them before (left) and after (right) compression with a weight. Here, h1 and h2 denote the respective heights of the sample before and after compression, and Δh is the difference in height due to the compression. |
2.1 Pebble compression experiments
The aim of the pebble compression experiment is to produce compressed agglomerates made of different pebble sizes in order to study the influence of the pebble size on the compression outcome. These experiments were performed with irregular micronsized silica grains with a material density of ρ0 = 2.6 g cm−3 and a diameter range between ∼0.5 μm and ∼10 μm. The material was chosen to enable a comparison with prior experimental findings and to investigate the impact of incorporating pebbles.
The silica pebbles (see Fig. 1) were manually produced by shaking the powder and sieving it to obtain the different size ranges. In contrast to Malamud et al. (2022), we used three different pebble diameter ranges for the samples, namely 1.6−2.5 mm, 0.5−0.8 mm, and 0.1−0.4 mm, respectively. After producing the pebbles, we weighed a certain amount and carefully poured them into a cylindrical metal container. In Fig. 2, we show a schematic sketch of the pebble-pile compression setup. The diameter of the container cavity was 1.95 cm. The pebbles were compressed using a stamp and different weights, as shown schematically in Fig. 2. We then extracted the samples from the holder to be able to use them for the BDT. In order to obtain cohesive samples for the BDT, a minimum pressure had to be applied. For the compression, we used weights between 1.0 kg and 8.0 kg in mass, reaching a maximum compression of ∼2.5 · 105 Pa. We measured the height of each compressed sample using a digital calliper, while the sample was still in the holder. Due to the fixed diameter for all samples, we calculated the volume of each sample from its measured height. With the volume of the sample and its mass, we obtained the bulk density ρ and therefore the VFF φ = ρ/ρ0 for each sample. It is important to note that the calculated values for the VFFs are mean values for entire samples.
In Fig. 3, we show the VFFs achieved by compressing the samples made of pebbles in the three different size ranges mentioned above. As we could not find any dependency of the compression curve on the pebble size, we fitted our results to Eq. (1), following the functional behaviour suggested by Malamud et al. (2024). We obtained
 (4)
where a = 0.132 ± 0.022 and b = 0.090 ± 0.014. We saved the samples that were taken out of the holder without breaking (see Fig. 4) for the BDT.
(4)
where a = 0.132 ± 0.022 and b = 0.090 ± 0.014. We saved the samples that were taken out of the holder without breaking (see Fig. 4) for the BDT.
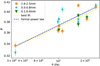 |
Fig. 3 Measured VFFs of the samples made from different pebble sizes as a function of compression. The solid yellow line denotes the best fit to all data following Eq. (4). The dashed blue line is the formal solution if the power-law fits in Eqs. (4) and (6) are used to derive the VFF-pressure relation in Eq. (9). |
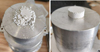 |
Fig. 4 Pebble piles after compression. The left image shows a broken sample while attempting to extract it from the holder, whereas the right image displays an intact compressed sample. |
2.2 Brazilian disk tests of pebble piles
The tensile strength is the maximum tension that a material can resist before it breaks. The BDT is an engineering method to measure the tensile strength of a material. It consists of pressing a discoidal sample until it breaks into two parts of similar size. At the moment of breakup, the tensile strength can be estimated by
 (5)
where F, d, and l are the exerted force at breakup (here measured by a scale), the diameter, and the height of the cylindrical sample, respectively. In Fig. 5, we show images of a compacted pebble-pile agglomerate before (left panel) and after (right panel) the breakup. The configuration of the setup is explained in San Sebastián et al. (2020) in detail.
(5)
where F, d, and l are the exerted force at breakup (here measured by a scale), the diameter, and the height of the cylindrical sample, respectively. In Fig. 5, we show images of a compacted pebble-pile agglomerate before (left panel) and after (right panel) the breakup. The configuration of the setup is explained in San Sebastián et al. (2020) in detail.
We performed the BDT for the compressed samples described above to obtain their values of tensile strength. For the experiments with a VFF φ < 0.34, the sample structure was so weak that they consistently broke whenever we extracted them from the compression-experiment sample holder (see Fig. 4); hence, they had to be excluded from the BDT analysis. In Fig. 6, we present the results of the tensile strength measurements for our samples with different VFFs φ>0.34. The results show that, within the restricted range of VFFs 0.36 ≲ φ ≲ 0.42, the tensile strength is independent of the pebble size.
Kreuzig et al. (2024) generated silica dust samples over a wide range of VFFs by gently evaporating dust-ice mixtures with various dust-to-ice mass ratios under vacuum conditions. The tensile strengths of these samples were then also measured using the BDT. Kreuzig et al. (2024) chose a power law to describe the relation between the VFF and tensile strength, which becomes σ = 0 for φ = 0, to guarantee a physically consistent description. We followed their functional behaviour (Eq. (2)) to fit our data and find
 (6)
with a′ = 3.28 · 106 ± 3.83 · 106 and b′ = 8.2 ± 1.28. The large error in the fitted parameters, especially for a′, is due to the narrow range of values in the dataset limited by the experimental setup. While the uncertainty allows for negative values of a′, these are unphysical and reflect the limitations of the fit rather than the actual behaviour.
(6)
with a′ = 3.28 · 106 ± 3.83 · 106 and b′ = 8.2 ± 1.28. The large error in the fitted parameters, especially for a′, is due to the narrow range of values in the dataset limited by the experimental setup. While the uncertainty allows for negative values of a′, these are unphysical and reflect the limitations of the fit rather than the actual behaviour.
In Fig. 7, we show with orange dots the dependence of the tensile strength on the pressure at which our samples were compressed. Blum et al. (2014) experimentally measured the tensile strengths of loose layers of dust pebbles, which we also show in Fig. 7 as light-blue crosses. Using both datasets and taking into account a finite tensile strength at zero compression caused by the van der Waals attraction among the pebbles (see Blum et al. 2014, for details), we fit the data using
 (7)
Ignoring the miniscule offset caused by the van der Waals attraction, we used Eq. (3) in the following form
(7)
Ignoring the miniscule offset caused by the van der Waals attraction, we used Eq. (3) in the following form
 (8)
with a′′ = 0.132 ± 0.019 and b′′ = 0.776 ± 0.018, shown as the dash-dotted yellow line in Fig. 7. For pressures above ∼100 Pa, the difference between Eqs. (7) and (8) is negligibly small.
(8)
with a′′ = 0.132 ± 0.019 and b′′ = 0.776 ± 0.018, shown as the dash-dotted yellow line in Fig. 7. For pressures above ∼100 Pa, the difference between Eqs. (7) and (8) is negligibly small.
As noted above, Eqs. (1)-(3) should be self-consistent. As we performed three different fitting procedures to these equations (see Eqs. (4), (6), and (8)), we examined whether this was the case. For this sanity check, we derived Eq. (1) from Eqs. (2) and (3) and formally obtained
 (9)
where propagating the uncertainties of the fitted parameters from Eqs. (6) and (8) into Eq. (9) yielded af = 0.125 ± 0.044 and bf = 0.095 ± 0.015. This curve is also shown in Fig. 3 as a dashed blue line. The difference between the formal result from Eq. (9) and the one directly fitted to the data (Eq. (4)) is very small and well within the respective uncertainties. This means that our approach to use power laws for all relations is self-consistent and valid for the range of VFFs, pressures, and tensile strengths covered in this work.
(9)
where propagating the uncertainties of the fitted parameters from Eqs. (6) and (8) into Eq. (9) yielded af = 0.125 ± 0.044 and bf = 0.095 ± 0.015. This curve is also shown in Fig. 3 as a dashed blue line. The difference between the formal result from Eq. (9) and the one directly fitted to the data (Eq. (4)) is very small and well within the respective uncertainties. This means that our approach to use power laws for all relations is self-consistent and valid for the range of VFFs, pressures, and tensile strengths covered in this work.
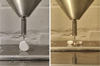 |
Fig. 5 BDT of granular samples. The pre-compacted pebble-pile aggregate is shown before (left) and after the breakup (right). |
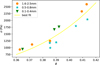 |
Fig. 6 Tensile strength of the samples made from different pebble sizes as a function of their VFF. The solid curve is the best-fitting power law shown in Eq. (6). |
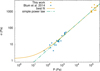 |
Fig. 7 Tensile strength of the samples as a function of the compression. The solid orange line represents the best-fitting Eq. (7) to the data from Blum et al. (2014) (light-blue crosses) and our data (orange dots). The dash-dotted yellow line represents the simple power law according to Eq. (8). |
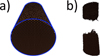 |
Fig. 8 Tensile strength simulation setup. (a) Initial configuration with the hexagonal packing as the interface between the tearing mesh in the front and the RBDR sample in the back. The backside of the RBDR sample was fixed. (b) Example of an RBDR sample torn apart. |
3 Simulations
We employed the DEM simulation framework Project Chrono, an open-source software optimised for granular and multibody dynamics, capable of efficiently handling contact and collision interactions among large numbers of particles, as detailed in Tasora et al. (2016). In our study, we modelled a cylindrical granular packing being torn apart and measured its tensile strength. The cylinder had a radius of rcyl = 1.5 cm, a length of lcyl = 6 cm, and was made up of mono-sized spheres with a radius of rs = 0.5 mm. Sphere packings were generated with the random ballistic deposition with rolling (RBDR) method described in Klar et al. (2024), which is a modified random ballistic deposition approach allowing for variable filling factors between φ = 0.15 and φ = 0.58. In order to tear the cylinder apart, one side of the sample was set as immovable in the simulation, while a cylindrical mesh was attached to the other side and an increasing tearing force was applied to it until the sample broke. Fig. 8 shows the numerical simulation setup of the tensile strength. A layer of densely packed spheres in a hexagonal lattice was placed between the mesh and the sample to facilitate better contact between the two. The sample was then grown directly on one side of this layer, while it provides a clean surface the other side to attach to the pulling mesh.
We measured the tensile force Fr applied to the mesh, averaging its value over 100 time steps (or 2 · 10−4 s) to reduce noise. At the point of structural failure, as shown in Fig. 9, the force sharply declined for VFF φ>0.3, and we calculated the tensile strength as
 (10)
with Fr, max being the maximum tensile force measured at the point of failure. For VFFs of φ ≤ 0.30, the break-up was not abrupt but showed some extended plastic deformation that ultimately ended in the separation of the two halves. This behaviour makes the determination of a unique break-up force and tensile strength difficult. Thus, the tensile-strength values for φ ≤ 0.30 are unreliable.
(10)
with Fr, max being the maximum tensile force measured at the point of failure. For VFFs of φ ≤ 0.30, the break-up was not abrupt but showed some extended plastic deformation that ultimately ended in the separation of the two halves. This behaviour makes the determination of a unique break-up force and tensile strength difficult. Thus, the tensile-strength values for φ ≤ 0.30 are unreliable.
The parameters chosen for the simulations are presented in Table 1. In order to scale the simulation results to the two cases of (i) dust aggregates (with typical particle sizes of 1 μm) and (ii) to packings of dust pebbles (millimetre-sized aggregates, consisting of micrometre-sized dust grains), we used the following relation between the tensile strength, the particle radius r, and the effective surface energy γ:
 (11)
with σs being the simulation results using the parameters given in Table 1 (see Eq. (10)). The reason for the scaling in Eq. (11) is that the contact force per particle scales as F0 ∝ γ r, according to the JKR (Johnson-Kendall-Roberts) theory (Johnson et al. 1971), whereas the number of particles per unit cross sections scales as N/A ∝ r−2. The relation σ ∝ F0 N/A ∝ r−1 has recently been experimentally proven by Kreuzig et al. (2024).
(11)
with σs being the simulation results using the parameters given in Table 1 (see Eq. (10)). The reason for the scaling in Eq. (11) is that the contact force per particle scales as F0 ∝ γ r, according to the JKR (Johnson-Kendall-Roberts) theory (Johnson et al. 1971), whereas the number of particles per unit cross sections scales as N/A ∝ r−2. The relation σ ∝ F0 N/A ∝ r−1 has recently been experimentally proven by Kreuzig et al. (2024).
In Fig. 10 (black triangles), the resulting tensile strengths for homogeneous (i.e. non-pebble-pile) packings with filling factors between 0.15 and 0.58 are shown for a dust-particle radius of r = 0.76 μm and a surface energy of γ=0.028 J m−2. The figure also includes experimental results from Sect. 2 (labelled ‘This work’), previous experimental results, and two empirical relations between tensile strength and VFF, as given by Eq. (5) of Kimura et al. (2020). We can observe that the modelled tensile strengths are reasonably well aligned with laboratory experiments and fall into the gap between the two model curves by Kimura et al. (2020). It should be noted that the grey triangles in Fig. 10 correspond to unreliable results.
We also applied the simulation results to the pebble-pile case (see Fig. 11), which is more complex, because it requires scaling of the surface energy from solid silica spheres (in the simulations) to dust pebbles (in the experiments). For aggregate-aggregate contacts, Skorov & Blum (2012) calculated the cohesion force among dust pebbles after a low-velocity sticking collision and arrived at
 (12)
with σ0 = 1.6 Pa and φpp being the VFF of the pebble packing. This relation is shown for r = 0.5 mm as the solid curve in Fig. 11. Blum et al. (2014) and Brisset et al. (2016) experimentally confirmed this relation for a pebble-size range of r ≈ 0.1−0.7 mm. For r = 0.5 mm, their experimental results yield a pebble-packing tensile strength of
(12)
with σ0 = 1.6 Pa and φpp being the VFF of the pebble packing. This relation is shown for r = 0.5 mm as the solid curve in Fig. 11. Blum et al. (2014) and Brisset et al. (2016) experimentally confirmed this relation for a pebble-size range of r ≈ 0.1−0.7 mm. For r = 0.5 mm, their experimental results yield a pebble-packing tensile strength of  , within the uncertainty range in the VFF of φpp = 0.30−0.64, and are shown as the solid rectangular box in Fig. 11.
As we do not know a priori the scaling factor between the surface energy of solid and aggregate particles, we chose an empirical approach by shifting the results obtained in our numerical simulations until they fit both the model predictions by Skorov & Blum (2012) and the experiments by Blum et al. (2014) and Brisset et al. (2016) for an arbitrarily selected VFF of φpp = 0.5 (see Fig. 11). This yields a scaling factor of 1/3 or γ=9.3 × 10⁻³ J m−2.
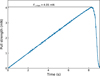 |
Fig. 9 Example of the tensile force acting on the cylindrical mesh as a function of simulated time for a tensile strength simulation of a pebble pile with φ = 0.55. As the force pulling on the sample linearly increases, the RBDR sample responds with an equal retracting force until its breaking point. The tensile strength is then determined as the maximum force Fr, max, which the sample can sustain before being torn apart, divided by its cross-sectional area. See Eq. (10). |
Material parameters of the tensile strength simulations of RBDR aggregates.
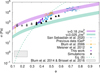 |
Fig. 10 Dependence of the tensile strength of packings of microgranular silica grains on the VFF. A comparison of the data obtained in this study (‘This work’) with measurements from San Sebastián et al. (2020) (grain-size range: 0.5 μm to 10 μm); hand-compressed samples ‘Previous data IGeP’ (grain-size range: 0.5 μm to 10 μm); Meisner et al. (2012) (grain-size range: 0.1 μm to 10 μm); and Blum et al. (2006) (grain-size range: 0.05 μm to 5 μm) is shown. The purple and light blue areas indicate the relation between the tensile strength and VFF obtained by Kimura et al. (2020, their Equation (5)) for γ=0.18 J/m2 and γ=0.025 J/m2, respectively. The widths of the two coloured curves mark the range of possible grain radii in the samples between 0.63 μm (upper limits of the two curves) and 2.05 μm (lower limits of the two curves). For comparison, our numerical simulations (rescaled to a monomer size of 0.76 μm) are shown as black triangles for φ>0.3, while the grey triangles indicate unreliable results for φ ≤ 0.3. The grey box stems from the data of Blum et al. (2014) and Brisset et al. (2016), corresponding to pebble-piles and/or aggregates. |
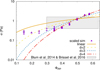 |
Fig. 11 Tensile strength of pebble piles, σpp, as a function of VFF, φpp. The box extending in VFF from 0.30 (Brisset et al. 2016) to 0.64 (random close packing RCP) and in strength from 0.4 Pa to 1.6 Pa stems from the data of Blum et al. (2014) and Brisset et al. (2016), rescaled to a pebble radius of 0.5 mm. The four curves show scaling laws σ ∝ φd, with d = 1 (Skorov & Blum 2012), d = 2 (Tatsuuma et al. 2019), d = 3, and d = 4 (Kreuzig et al. 2024). All four curves are forced to cross at φpp = 0.5. The data points show the results of the simulations with a scaling factor of 1/3 applied (see text for details) so that they also cross the four model curves at φpp = 0.5. |
4 Discussion and outlook
We performed pebble-pile compression experiments at much higher compressive stresses (∼105 Pa) than those by Blum et al. (2014) (∼102−103 Pa) and found a joint relation between tensile strength and compressive stress, as shown in Eq. (7). This joint fit differs insofar from the previous observation by Blum et al. (2014), who suggested a linear increase in tensile strength with compression, i.e. b′′ = 1, for pebble piles. However, when we include our new results obtained at much higher compressive stresses, we can see that the relation between tensile strength and compression is slightly sub-linear, with a slope of b′′ = 0.776 (see Fig. 7 and Eq. (8)). The corresponding relation between tensile strength and VFF is given by Eq. (6), displayed as the dashed curve in Fig. 10. As seen in Fig. 10, pebble piles possess lower tensile strengths than homogeneous (i.e. non-pebble-pile) dust aggregates for VFFs φ ≲ 0.4. Above this value, the pebbles obviously are either destroyed or so heavily deformed that they lose their characteristic low strength. Our findings about the compressibility of pebble piles align well with those of Malamud et al. (2022) for the same material (irregular SiO2). However, our derived functional behaviour differs from their work, because we used, due to the narrower range of VFF in our experiments, a simple power-law ansatz (Eq. (4)). In contrast Malamud et al. (2022) described it with a linear-log function.
It is interesting to note that Malamud et al. (2024) derived a master equation for the φ(P) relation, valid over a wide pressure range of P = 300 Pa–1 GPa, which is given by (rescaled to P = 1 Pa, instead of their P = 1 MPa): φ = 0.118(P/1 Pa)0.09, i.e. a = 0.118 and b = 0.09, very close to our results shown in Eq. (4).
As far as the tensile strength of homogeneous (i.e. non-pebble-pile) aggregates is concerned, our new data align well (see Fig. 10) with those of our previous work (San Sebastián et al. 2020) and of Meisner et al. (2012). Meisner et al. (2012) conducted laboratory experiments to measure the mechanical properties of centimetre-sized polydisperse SiO2 dust samples (the same as in our experiments) of different VFFs between φ = 0.34 and φ = 0.50. Considering that the tensile strength is independent of the pebble size for this range of VFF (φ ≳ 0.4, see above and Fig. 6), and that these values agree with previous results for compact samples made of irregular silica dust, we infer that, at these pressures, the pebble structure experiences significant or near-complete deformation or disintegration. Consequently, the behaviour of pebble-pile aggregates aligns with that of the non-pebble dust samples. However, it is important to note that this conclusion cannot be extrapolated to pebble-pile aggregates with lower VFFs of φ ≲ 0.4. In fact, from Fig. 10 we can see that Eq. (6) can be used to track back the measurements by Blum et al. (2014) and Brisset et al. (2016) and fits this data well, where the intersection of Eq. (6) with the relations of Kimura et al. (2020) around φ = 0.4 gives us the transition between pebble-pile and non-pebble-pile behaviour. It is important to note that the validity of the power-law formula cannot be extrapolated for higher values of VFF, only for pebble piles. In Fig. 10 we can also see that the numerical simulations match the experimental results and provide values for the tensile strength for VFFs of micro-granular packings that have not yet been investigated by laboratory experiments. Moreover, the simulated values lie within the ranges of the approximations adopting the Kimura et al. (2020) relation (their Eq. (5)), as done in San Sebastián et al. (2020), using two values for the grain radius r0: the average particle radius by number is r0 = 0.63 μm and by mass r0 = 2.05 μm for the irregular silica (Kothe et al. 2013). Instead of fitting the surface energy γ, we present here the minimum and maximum range of this parameter.
Let us now turn our attention to the tensile strength of pebble-pile aggregates with φ ≲ 0.4. We wonder how the low cohesion of these structures measured by Blum et al. (2014) and Brisset et al. (2016) can be modelled. A purely static approach was suggested by Weidling et al. (2012), who derived the surface energy of pebbles, γp, to that of the solid material, γ, by using the relation
 (13)
with φp being the VFF of the dust grains inside the pebbles and r being the contact radius of two equal-sized monomer grains of radius r0, given by
(13)
with φp being the VFF of the dust grains inside the pebbles and r being the contact radius of two equal-sized monomer grains of radius r0, given by
 (14)
Here, v0 and E0 are the Poisson number and Young’s modulus of the grain material (Johnson et al. 1971). The ratio
(14)
Here, v0 and E0 are the Poisson number and Young’s modulus of the grain material (Johnson et al. 1971). The ratio  is often called the Hertz factor. For the material values given in Table 1 – except for E0 = 73 GPa – and r0 = 0.76 μm, we get H = 2.2 × 10⁻⁴. With φp = 0.4, we get an effective surface energy of γp = 2.5 × 10⁻⁶ J/m2. An estimate of the static tensile strength of a granular packing of pebbles with radii rp can then be made by dividing the typical cohesion force per pebble:
 (15)
from the JKR model through the available cross section per pebble, taking into account the VFF, i.e.
(15)
from the JKR model through the available cross section per pebble, taking into account the VFF, i.e.
 (16)
with φpp being the VFF of the pebble packing. The bulk VFF of the pebble packing then becomes φ = φp φpp. Using the value for γp derived above, we get for rp = 5 mm and φpp = 0.5 for the tensile strength σp = 3.75 × 10⁻⁴ Pa. When compared to the measurements by Blum et al. (2014) and Brisset et al. (2016), this value is too low by orders of magnitude.
(16)
with φpp being the VFF of the pebble packing. The bulk VFF of the pebble packing then becomes φ = φp φpp. Using the value for γp derived above, we get for rp = 5 mm and φpp = 0.5 for the tensile strength σp = 3.75 × 10⁻⁴ Pa. When compared to the measurements by Blum et al. (2014) and Brisset et al. (2016), this value is too low by orders of magnitude.
Thus, the pebble-pebble contact cannot be treated statically. Skorov & Blum (2012) developed a dynamical model that agrees with the measurements by Blum et al. (2014) and Brisset et al. (2016). When a pebble pile is formed, the pebbles either stick directly at first contact or bounce and lose kinetic energy until they ultimately stick. Taking the sticking-bouncing threshold into account, Skorov & Blum (2012) yielded for the tensile strength of a pebble pile the following relation:
 (17)
Thus, plastic deformation during the contact formation between pebbles plays a major role for the resulting tensile strength of pebble piles. This is also evidenced by the observation of low coefficients of restitution (see e.g. Weidling et al. 2012) as well as an increase in VFF for initially very fluffy pebbles in bouncing collisions (Weidling et al. 2009). As a consequence of plastic deformation, the contact area between two touching pebbles is much larger than expected by pure van der Waals contact. This has the important consequence that the thermal conductivity of pebble piles is increased over the elastic case. For the thermal conductivity, the Hertz factor of the pebble-pebble contact plays a major role because these two values scale linearly.
(17)
Thus, plastic deformation during the contact formation between pebbles plays a major role for the resulting tensile strength of pebble piles. This is also evidenced by the observation of low coefficients of restitution (see e.g. Weidling et al. 2012) as well as an increase in VFF for initially very fluffy pebbles in bouncing collisions (Weidling et al. 2009). As a consequence of plastic deformation, the contact area between two touching pebbles is much larger than expected by pure van der Waals contact. This has the important consequence that the thermal conductivity of pebble piles is increased over the elastic case. For the thermal conductivity, the Hertz factor of the pebble-pebble contact plays a major role because these two values scale linearly.
The relations derived in this work between VFF, pressure, and tensile strength describe the mechanical behaviour of granular aggregates over a wide range of compaction states. In particular, they can be used to constrain models of planetesimal formation through the gravitational collapse of pebble clouds, where the aggregate strength plays a key role in determining the survival of the bodies in the early collisional environment (e.g. Blum et al. 2017).
5 Summary and conclusions
In this paper, we investigated the compressibility and strength of pebble piles. First, we generated pebbles of various sizes made from irregular silica. We used these pebbles to construct pebble-pile samples and applied different weights to compress them, allowing us to obtain their crush curve. We then applied the Brazilian disk test (BDT) to the compressed samples with a range of volume filling factors (VFFs) to measure their tensile strength. Finally, to contrast with the laboratory experiments, we also performed DEM simulations to calculate the tensile strength and compared them with previous experiments.
Our main findings are:
The tensile strength of pebble piles within the calculated range of VFFs is independent of the pebble size they are composed of;
The tensile strength obtained by simulations is in good agreement with laboratory results, which also validates the model adopted in the simulations;
A new relationship for the tensile strength as a function of pressure for pebble piles has been established, which provides a better fit at higher pressures compared to the previous model;
Within the range of VFFs used for the BDT, the tensile strength of pebble piles is found to be comparable to that of dust samples. Therefore, we can conclude that at the pressures, which these samples were made, the structure of the pebbles is significantly or near-completely disintegrated;
A relation between the tensile strength and the VFF following Kreuzig et al. (2024) was calculated. Nevertheless, as Kreuzig et al. (2024) state in their work, further studies must be done to complete the full range of VFFs. A challenge for the future is to conduct laboratory experiments to study the behaviour of pebble piles made from different pebble sizes for lower VFFs;
The use of power-law functions to describe the relationships between pressure, porosity, and tensile strength shows internal consistency and agreement with the experimental results over the investigated parameter ranges;
At low VFFs (φ ≲ 0.4), static cohesion models significantly underestimate the tensile strength of pebble piles. Our results suggest that a dynamic contact formation model is consistent with previous findings, in which plastic deformation during pebble collisions plays a major role in the resulting tensile strength.
This study contributes to the estimation of tensile strength and compressibility measurements, expanding our knowledge about the behaviour of pebble piles. The properties of pebble-pile structures are critical for understanding early planetesimal formation and their remnants in the Solar System.
Acknowledgements
The laboratory experiments were done during a short research stay funded by IGEP. I.L.S.S. was partially supported by PIP-2971 from CONICET (Argentina) and by PICT 2020-03316 from Agencia I+D+i (Argentina). Co-funded by the European Union (ERC, TRACES, 101077758). Views and opinions expressed are however those of the author(s) only and do not necessarily reflect those of the European Union or the European Research Council. Neither the European Union nor the granting authority can be held responsible for them. We thank the anonymous reviewer for their helpful comments to improve the paper.
References
- Baer, J., Chesley, S. R., & Matson, R. D., 2011, AJ, 141, 143 [NASA ADS] [CrossRef] [Google Scholar]
- Beitz, E., Güttler, C., Nakamura, A. M., Tsuchiyama, A., & Blum, J., 2013, Icarus, 225, 558 [Google Scholar]
- Blum, J., Schräpler, R., Davidsson, B. J. R., & Trigo-Rodríguez, J. M., 2006, ApJ, 652, 1768 [NASA ADS] [CrossRef] [Google Scholar]
- Blum, J., Gundlach, B., Mühle, S., & Trigo-Rodriguez, J. M., 2014, Icarus, 235, 156 [Google Scholar]
- Blum, J., Gundlach, B., Krause, M., et al. 2017, MNRAS, 469, S755 [Google Scholar]
- Blum, J., Bischoff, D., & Gundlach, B., 2022, Universe, 8, 381 [CrossRef] [Google Scholar]
- Brisset, J., Heißelmann, D., Kothe, S., Weidling, R., & Blum, J., 2016, A&A, 593, A3 [NASA ADS] [CrossRef] [EDP Sciences] [Google Scholar]
- Bürger, J., Glißmann, T., Lethuillier, A., et al. 2023, MNRAS, 519, 641 [Google Scholar]
- Capelo, H. L., Bodénan, J.-D., Jutzi, M., et al. 2024, MNRAS, 533, 2762 [Google Scholar]
- Groussin, O., Attree, N., Brouet, Y., et al. 2019, Space Sci. Rev., 215, 29 [Google Scholar]
- Güttler, C., Krause, M., Geretshauser, R. J., Speith, R., & Blum, J., 2009, ApJ, 701, 130 [CrossRef] [Google Scholar]
- Johnson, K. L., Kendall, K., & Roberts, A. D., 1971, Proc. R. Soc. Lond., 324, 301 [Google Scholar]
- Jutzi, M., Benz, W., Toliou, A., Morbidelli, A., & Brasser, R., 2017, A&A, 597, A61 [NASA ADS] [CrossRef] [EDP Sciences] [Google Scholar]
- Kelly, C., Olsen, N., & Negrut, D., 2020, Multibody Syst. Dyn., 50, 355 [Google Scholar]
- Kimura, H., Wada, K., Yoshida, F., et al. 2020, MNRAS, 496, 1667 [NASA ADS] [CrossRef] [Google Scholar]
- Klar, L., Glißmann, T., Lammers, K., Güttler, C., & Blum, J., 2024, Granular Matter, 26, 59 [Google Scholar]
- Kothe, S., Blum, J., Weidling, R., & Güttler, C., 2013, Icarus, 225, 75 [Google Scholar]
- Kreuzig, C., Bischoff, D., Meier, G., et al. 2024, A&A, 688, A177 [NASA ADS] [CrossRef] [EDP Sciences] [Google Scholar]
- Luther, R., Raducan, S. D., Burger, C., et al. 2022, Planet. Sci. J., 3, 227 [Google Scholar]
- Macke, R. J., Consolmagno, G. J., Britt, D. T., & Hutson, M. L., 2010, Meteor. Planet. Sci., 45, 1513 [NASA ADS] [CrossRef] [Google Scholar]
- Macke, R. J., Consolmagno, G. J., & Britt, D. T., 2011, Meteor. Planet. Sci., 46, 1842 [Google Scholar]
- Malamud, U., & Prialnik, D., 2015, Icarus, 246, 21 [NASA ADS] [CrossRef] [Google Scholar]
- Malamud, U., Landeck, W. A., Bischoff, D., et al. 2022, MNRAS, 514, 3366 [NASA ADS] [CrossRef] [Google Scholar]
- Malamud, U., Schäfer, C. M., Luciana San Sebastián, I., et al. 2024, ApJ, 974, 76 [Google Scholar]
- Meisner, T., Wurm, G., & Teiser, J., 2012, A&A, 544, A138 [NASA ADS] [CrossRef] [EDP Sciences] [Google Scholar]
- Raducan, S. D., Jutzi, M., Merrill, C. C., et al. 2024, Planet. Sci. J., 5, 79 [NASA ADS] [CrossRef] [Google Scholar]
- San Sebastián, I. L., Dolff, A., Blum, J., Parisi, M. G., & Kothe, S., 2020, MNRAS, 497, 2418 [CrossRef] [Google Scholar]
- Schwartz, S. R., Richardson, D. C., & Michel, P., 2012, Granular Matter, 14, 363 [Google Scholar]
- Skorov, Y., & Blum, J., 2012, Icarus, 221, 1 [Google Scholar]
- Sunday, C., Murdoch, N., Tardivel, S., Schwartz, S. R., & Michel, P., 2020, MNRAS, 498, 1062 [NASA ADS] [CrossRef] [Google Scholar]
- Tasora, A., Serban, R., Mazhar, H., et al. 2016, in High Performance Computing in Science and Engineering: Second International Conference, HPCSE 2015, Soláň, Czech Republic, May 25–28, 2015, Revised Selected Papers 2 (Springer), 19 [Google Scholar]
- Tatsuuma, M., Kataoka, A., & Tanaka, H., 2019, ApJ, 874, 159 [Google Scholar]
- Weidling, R., Güttler, C., Blum, J., & Brauer, F., 2009, ApJ, 696, 2036 [NASA ADS] [CrossRef] [Google Scholar]
- Weidling, R., Güttler, C., & Blum, J., 2012, Icarus, 218, 688 [Google Scholar]
- Wimarsson, J., Xiang, Z., Ferrari, F., et al. 2024, Icarus, 421, 116223 [Google Scholar]
- Yasui, M., & Arakawa, M., 2009, J. Geophys. Res. (Planets), 114, E09004 [Google Scholar]
- Zhang, Y., Michel, P., Richardson, D. C., et al. 2021, Icarus, 362, 114433 [CrossRef] [Google Scholar]
All Tables
All Figures
|
Fig. 1 Examples of SiO2 pebbles with diameters between 1.6 mm and 2.5 mm produced in the laboratory. |
| In the text | |
|
Fig. 2 Schematic sketch of the compression experiment showing the hollow cylinder with the pebbles inside and the stamp above them before (left) and after (right) compression with a weight. Here, h1 and h2 denote the respective heights of the sample before and after compression, and Δh is the difference in height due to the compression. |
| In the text | |
|
Fig. 3 Measured VFFs of the samples made from different pebble sizes as a function of compression. The solid yellow line denotes the best fit to all data following Eq. (4). The dashed blue line is the formal solution if the power-law fits in Eqs. (4) and (6) are used to derive the VFF-pressure relation in Eq. (9). |
| In the text | |
|
Fig. 4 Pebble piles after compression. The left image shows a broken sample while attempting to extract it from the holder, whereas the right image displays an intact compressed sample. |
| In the text | |
|
Fig. 5 BDT of granular samples. The pre-compacted pebble-pile aggregate is shown before (left) and after the breakup (right). |
| In the text | |
|
Fig. 6 Tensile strength of the samples made from different pebble sizes as a function of their VFF. The solid curve is the best-fitting power law shown in Eq. (6). |
| In the text | |
|
Fig. 7 Tensile strength of the samples as a function of the compression. The solid orange line represents the best-fitting Eq. (7) to the data from Blum et al. (2014) (light-blue crosses) and our data (orange dots). The dash-dotted yellow line represents the simple power law according to Eq. (8). |
| In the text | |
|
Fig. 8 Tensile strength simulation setup. (a) Initial configuration with the hexagonal packing as the interface between the tearing mesh in the front and the RBDR sample in the back. The backside of the RBDR sample was fixed. (b) Example of an RBDR sample torn apart. |
| In the text | |
|
Fig. 9 Example of the tensile force acting on the cylindrical mesh as a function of simulated time for a tensile strength simulation of a pebble pile with φ = 0.55. As the force pulling on the sample linearly increases, the RBDR sample responds with an equal retracting force until its breaking point. The tensile strength is then determined as the maximum force Fr, max, which the sample can sustain before being torn apart, divided by its cross-sectional area. See Eq. (10). |
| In the text | |
|
Fig. 10 Dependence of the tensile strength of packings of microgranular silica grains on the VFF. A comparison of the data obtained in this study (‘This work’) with measurements from San Sebastián et al. (2020) (grain-size range: 0.5 μm to 10 μm); hand-compressed samples ‘Previous data IGeP’ (grain-size range: 0.5 μm to 10 μm); Meisner et al. (2012) (grain-size range: 0.1 μm to 10 μm); and Blum et al. (2006) (grain-size range: 0.05 μm to 5 μm) is shown. The purple and light blue areas indicate the relation between the tensile strength and VFF obtained by Kimura et al. (2020, their Equation (5)) for γ=0.18 J/m2 and γ=0.025 J/m2, respectively. The widths of the two coloured curves mark the range of possible grain radii in the samples between 0.63 μm (upper limits of the two curves) and 2.05 μm (lower limits of the two curves). For comparison, our numerical simulations (rescaled to a monomer size of 0.76 μm) are shown as black triangles for φ>0.3, while the grey triangles indicate unreliable results for φ ≤ 0.3. The grey box stems from the data of Blum et al. (2014) and Brisset et al. (2016), corresponding to pebble-piles and/or aggregates. |
| In the text | |
|
Fig. 11 Tensile strength of pebble piles, σpp, as a function of VFF, φpp. The box extending in VFF from 0.30 (Brisset et al. 2016) to 0.64 (random close packing RCP) and in strength from 0.4 Pa to 1.6 Pa stems from the data of Blum et al. (2014) and Brisset et al. (2016), rescaled to a pebble radius of 0.5 mm. The four curves show scaling laws σ ∝ φd, with d = 1 (Skorov & Blum 2012), d = 2 (Tatsuuma et al. 2019), d = 3, and d = 4 (Kreuzig et al. 2024). All four curves are forced to cross at φpp = 0.5. The data points show the results of the simulations with a scaling factor of 1/3 applied (see text for details) so that they also cross the four model curves at φpp = 0.5. |
| In the text | |
Current usage metrics show cumulative count of Article Views (full-text article views including HTML views, PDF and ePub downloads, according to the available data) and Abstracts Views on Vision4Press platform.
Data correspond to usage on the plateform after 2015. The current usage metrics is available 48-96 hours after online publication and is updated daily on week days.
Initial download of the metrics may take a while.